
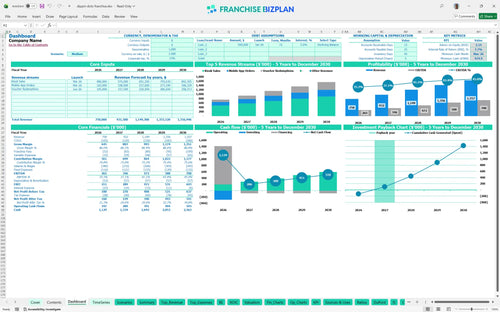
All-in-one Dashboard
Core inputs and core outputs


This template provides a data-driven roadmap for evaluating the unit economics and investment feasibility of a high-traffic frozen treat kiosk.
Core inputs and core outputs
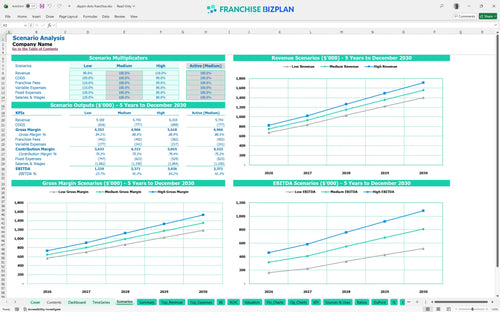
Three scenario analysis
Presentation ready
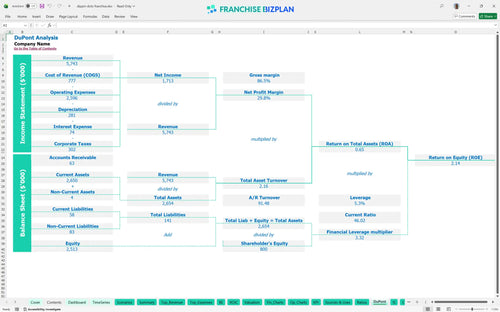
DuPont analysis
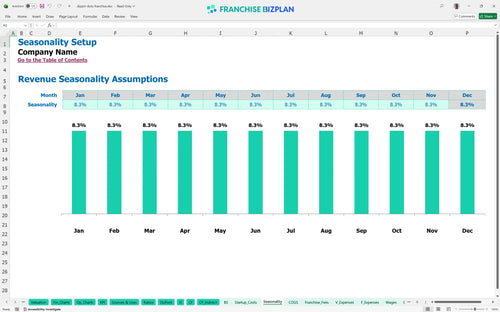
Researched revenue assumptions
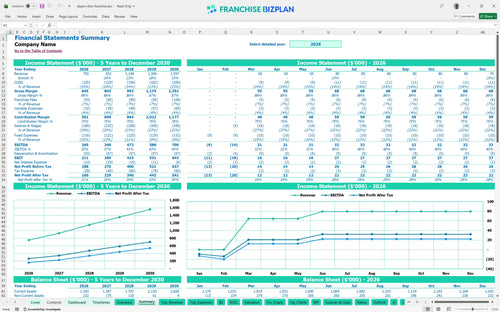
Lender-friendly financial outputs
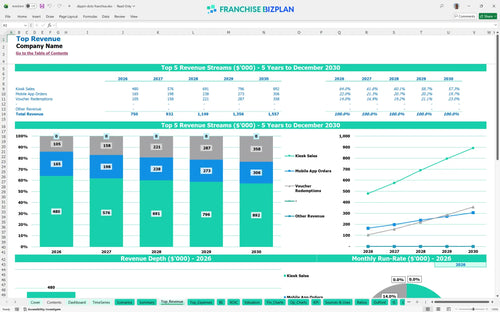
Revenue stream detailed view
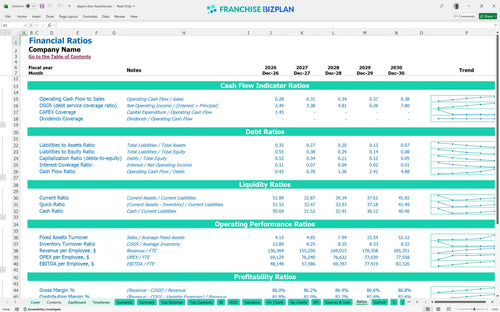
Performance metrics benchmark
We built this Dippin' Dots Franchise franchise unit financial model using our own research to provide a realistic view of store-level performance. Key assumptions like the $35,000 franchise fee, 6% royalty, and $6,500 monthly rent are pre-populated and fully editable to match your specific ICON Park or mall location. With a projected Year 1 EBITDA of $265,000, this model helps you track how high-volume kiosk sales translate into actual owner distributions.
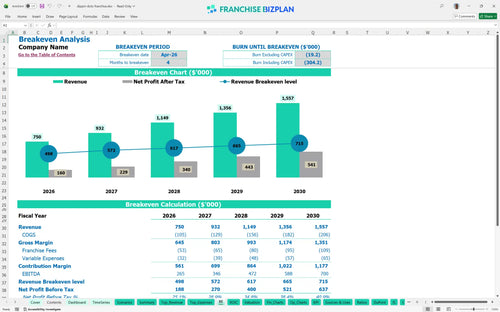
This franchise unit hits profitability quickly, reaching break-even by April 2026, just four months after launch. With Year 1 EBITDA projected at $265,000 and growing to $700,000 by Year 5, the model shows a strong upward trend as voucher redemptions and app orders scale. Estimating profitability for high-traffic food franchise units requires looking closely at these tiered revenue streams.
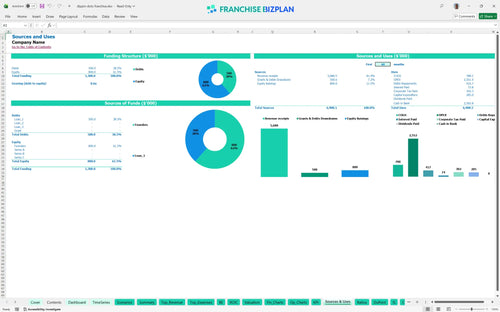
You will need approximately $285,000 in upfront capital to cover the $35,000 franchise fee, $120,000 kiosk build-out, and $50,000 for specialized cryogenic freezers. This investment also includes neon signage and POS systems to ensure the unit is ready for high-volume tourist traffic. Learning how to calculate startup costs for a food franchise is the first step in capital expenditure planning.
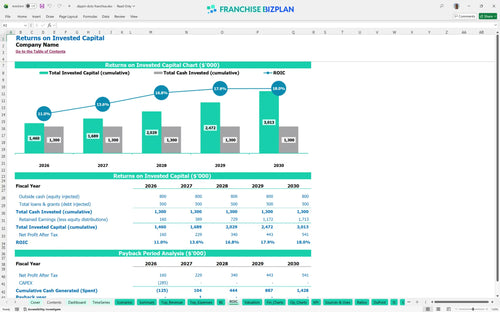
Investors can expect an Internal Rate of Return (IRR) of 7.72% and a Return on Equity (ROE) of 2.14. The payback period is notably short at 2 years, meaning you recover your initial investment fast compared to traditional brick-and-mortar food concepts. This ROI analysis is essential for any franchise unit performance tracking spreadsheet used by multi-unit operators.
The unit reaches its monthly break-even point in April 2026, requiring about four months of operation to cover fixed costs like the $6,500 prime rent. Labor and rent are the primary drivers here, so managing throughput during peak hours is essential to hitting this milestone. This break-even analysis for small business franchise units helps you set daily sales targets for your manager.
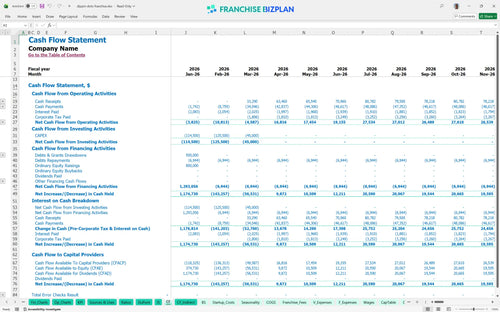
The lowest cash point occurs in March 2026 with a minimum cash balance of $975,000, suggesting a very healthy liquidity position if you start with significant reserves. Still, you should maintain a buffer to handle the $1,400 monthly cryogenic utility costs and potential delays in kiosk construction. An operational cash flow forecast ensures you never run lean during the critical ramp-up phase.
Moving from a Medium to a High scenario significantly boosts Year 1 margin by leveraging the fixed $6,500 rent against higher sales volumes. If Kiosk Sales exceed the base $320,000, the 6% royalty remains constant, but your store-level EBITDA margin expands rapidly due to operating leverage. Analyzing operating expenses for retail food kiosks helps you see how sensitive your profit is to labor costs.
This franchise unit financial model is a flexible Excel tool designed to help you stress-test your assumptions before signing a lease. It features pre-filled formulas and editable inputs for revenue, labor, and overhead, allowing you to adapt the numbers to your specific territory or mall kiosk. Using a franchise startup cost calculator helps you visualize how small changes in rent or staffing affect your bottom line.

Planning for the long term is vital when dealing with high-traffic retail units where margins can shift based on seasonal foot traffic. This model provides a full 5-year outlook on revenue, store-level EBITDA, and cash flow to ensure your growth is sustainable. A detailed franchise investment analysis ensures you understand how Year 1 sales of $750,000 can scale to over $1.5 million by Year 5.

Understanding your off-the-top costs is critical for any operator. This tool tracks the 6% royalty and 1% marketing fund contributions against your gross sales, showing exactly how much cash stays in the unit after the franchisor gets paid. Managing this franchise royalty fee structure is key to maintaining a healthy retail kiosk profit model in premium locations.

Launching a kiosk requires significant upfront capital, from the $35,000 franchise fee to the $120,000 build-out. This analysis identifies your total initial investment and calculates the exact monthly sales volume needed to cover your fixed costs and start generating profit. It serves as a franchise investment feasibility study template for those evaluating prime tourist locations.

Don't fly blind when estimating your labor or occupancy costs. The model includes industry-standard benchmarks for food service kiosks, helping you verify if your $6,500 monthly rent or 12% ingredient costs are in line with successful operators. These best practices for food franchise financial planning help you sanity-check your unit economics against real-world performance.


Simply purchase and download the financial model template, then access it instantly using Microsoft Excel or Google Sheets. No installation or technical expertise required-just open and start working.

Enter your business-specific numbers, including revenue projections, costs, and investment details. The pre-built formulas will automatically calculate financial insights, saving you time and effort.

Leverage the investor-ready format to confidently showcase your financial projections to banks, franchise representatives, or investors. Impress stakeholders with clear, data-driven insights and professional reports.

Leverage the investor-ready format to confidently present your projections to banks, franchise representatives, or investors.