
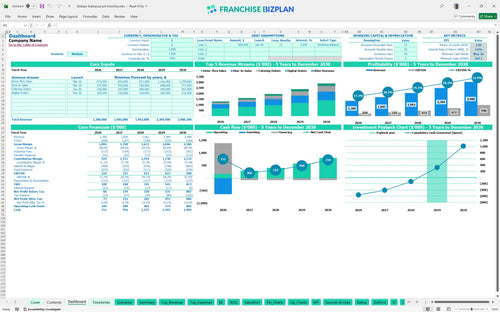
All-in-one Dashboard
Core inputs and core outputs


This comprehensive BBQ franchise financial model includes a full suite of Excel-based tools for forecasting revenue, managing startup costs, and analyzing 5-year profitability for a single unit or territory.
Core inputs and core outputs
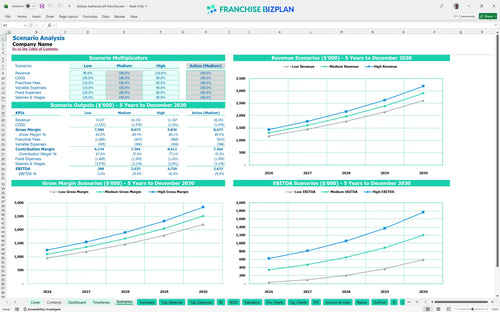
Three scenario analysis
Presentation ready
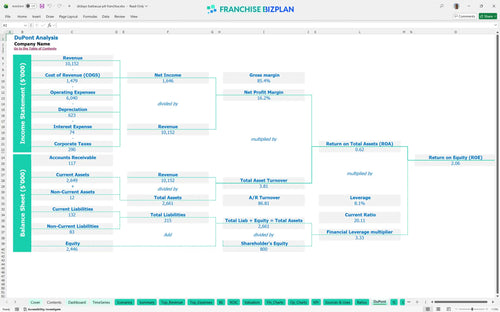
DuPont analysis
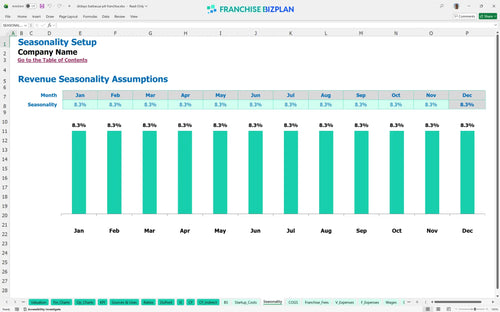
Researched revenue assumptions
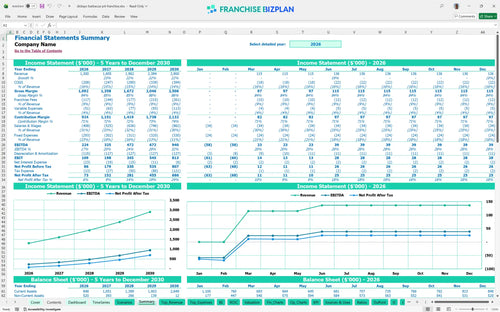
Lender-friendly financial outputs
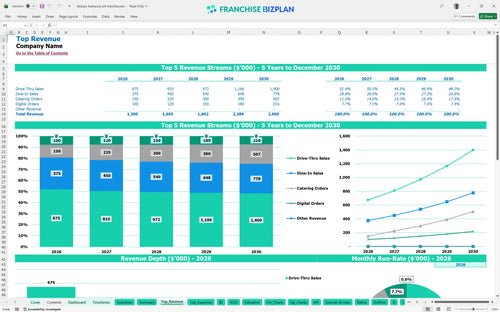
Revenue stream detailed view
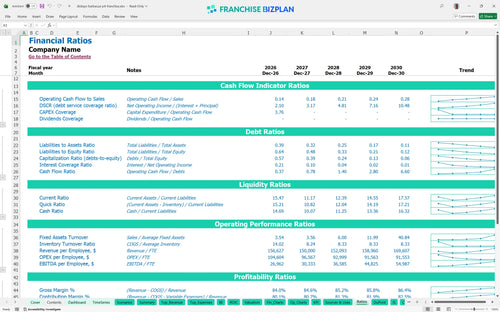
Performance metrics benchmark
We built this franchise unit financial model using deep research into the fast-casual barbecue sector to ensure every number reflects reality. Key assumptions like your $18,000 monthly rent, 6% royalty fees, and $1.3 million year-one revenue are pre-populated but fully editable to fit your specific site. This is a practical tool for evaluating franchise investment opportunities for restaurants without the guesswork.
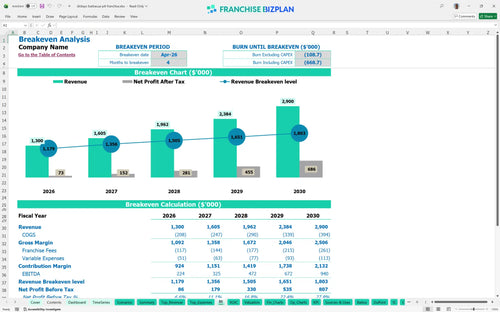
This unit hits its stride and becomes profitable by April 2026, just four months after opening. With an initial EBITDA of $224,000 in the first year, the model shows a steady climb as catering and drive-thru volume increases. You'll defintely need to watch your meat costs and labor efficiency to hit these numbers early on.
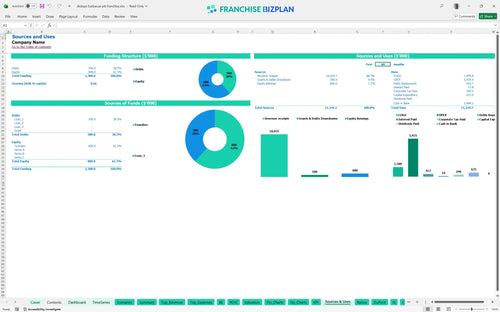
You will need approximately $635,000 to cover the total startup investment, which includes the franchise fee and all specialized equipment. This barbecue restaurant profit and loss statement template accounts for everything from the $110,000 smokers to the $60,000 drive-thru infrastructure. Plus, you should keep a cash buffer for the first few months of ramp-up.
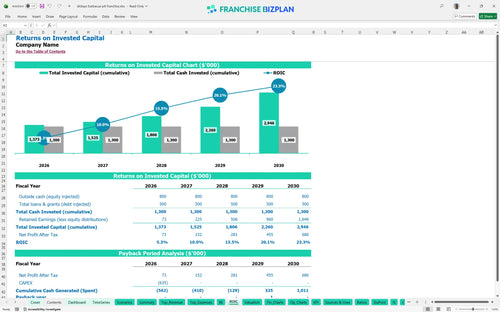
The model projects a 3.91% Internal Rate of Return (IRR) with a full payback of your initial capital within 4 years. While the initial return on equity is 2.06, the cash flow scales significantly by year five, reaching an EBITDA of $940,000. Here's the quick math: your patience in the first 36 months pays off as the unit matures.
Your monthly break-even occurs in month 4, provided you hit your combined revenue targets from the drive-thru and dine-in channels. The biggest driver for reaching this point is managing your $18,000 prime location rent and the 9% total royalty and marketing burden. If traffic is slow, you must adjust crew hours immediately to protect the margin.
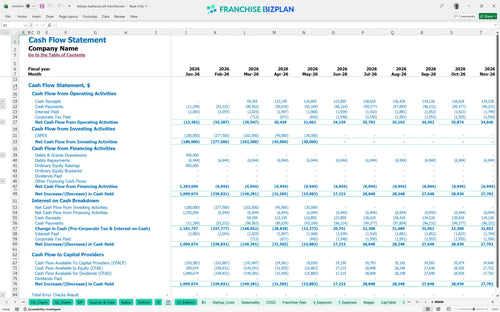
The lowest cash point occurs in May 2026, with a minimum cash balance of $563,000 after all initial expenses are paid. This means you need a solid liquidity position to survive the pre-opening phase and the first few months of trading. Effective cash managment during the build-out phase is critical to avoid a mid-project funding gap.
Switching to a high-growth scenario can push your year-five revenue toward $3 million, significantly shortening your payback period. However, a low-volume scenario would squeeze your margins due to the $18,000 fixed rent and the $70,000 manager salary. Scenarios help you see how a 10% drop in drive-thru traffic affects your ability to cover fixed costs.
Finance: update unit break-even and payback model by Friday
This BBQ franchise financial model provides a flexible Excel environment where you can adjust every variable from smoker capacity to drive-thru speed. It uses pre-filled formulas and editable assumptions so you can defintely tailor the projections to your specific territory or local labor market without starting from scratch. Here's the quick math: you can toggle meat prices or shift counts and see the impact on your bottom line instantly. One small change in your average ticket can shift your whole year.

You get a detailed 5-year roadmap that tracks your growth from an initial $1.3 million in year one to a projected $2.9 million by year five. This model handles the long-tail view of franchise unit financial projections, including the ramp-up of catering revenue and digital orders over time. It's built for multi-unit operators who need to see how store-level EBITDA (earnings before interest, taxes, depreciation, and amortization) scales as the unit matures. Planning for five years helps you spot the gap between opening and true market density.

The model automatically calculates your 6% royalty and 3% marketing fund contributions to ensure you understand the true cost of brand alignment. By capturing these franchise royalty fees alongside the initial $50,000 franchise fee, you can see exactly how much cash stays in the store versus going to the head office. Honestly, many owners forget that these fees apply to gross sales, not net profit, so we've baked that logic right in. Managing these obligations is the core of franchise profitability analysis.

This tool maps out your $635,000 in capital expenditure planning, covering everything from the $110,000 BBQ pits to the $220,000 in leasehold improvements. You will see exactly when your monthly revenue covers both your $18,000 rent and your variable meat costs, which start at 13.5% of sales. Knowing your break-even point helps you manage the stress of those first few months of operation. If your build-out takes longer than 90 days, your working capital needs will change fast.

We have integrated real-world restaurant operating expenses and benchmarks to help you sanity-check your meat waste and labor productivity. For example, the model assumes meat and protein costs will trend down from 13.5% to 11.5% as your pitmasters get more efficient with the smokers. You can compare your projected performance against typical fast casual restaurant business plan standards to ensure your goals are realistic. Using these benchmarks prevents you from being too optimistic about your store-level margin.


Simply purchase and download the financial model template, then access it instantly using Microsoft Excel or Google Sheets. No installation or technical expertise required-just open and start working.

Enter your business-specific numbers, including revenue projections, costs, and investment details. The pre-built formulas will automatically calculate financial insights, saving you time and effort.

Leverage the investor-ready format to confidently showcase your financial projections to banks, franchise representatives, or investors. Impress stakeholders with clear, data-driven insights and professional reports.

Leverage the investor-ready format to confidently present your projections to banks, franchise representatives, or investors.