
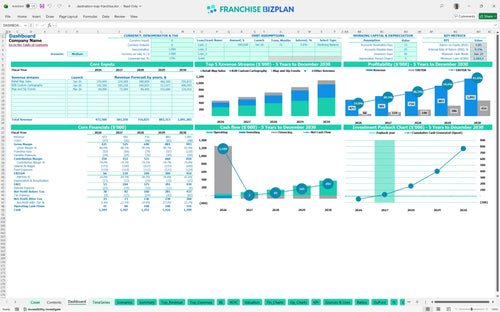
All-in-one Dashboard
Core inputs and core outputs


This franchise unit financial projection spreadsheet provides a detailed startup budget for a local business franchise along with automated five-year income statements and cash flow trackers.
Core inputs and core outputs
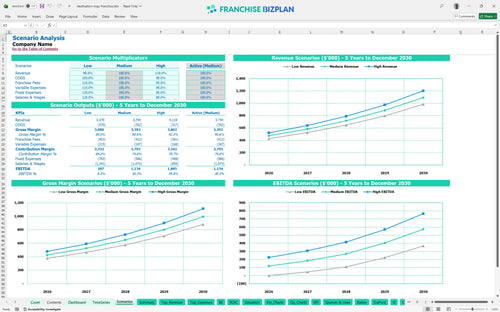
Three scenario analysis
Presentation ready
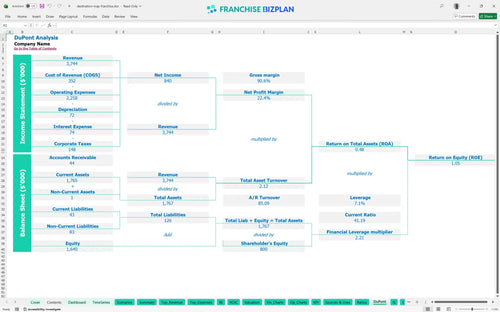
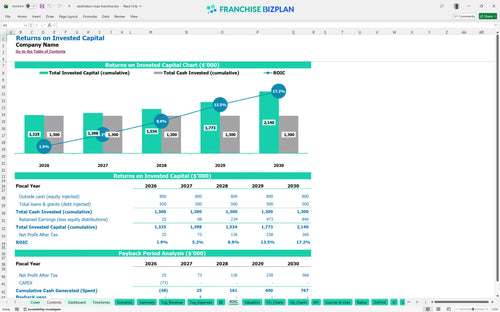
DuPont analysis
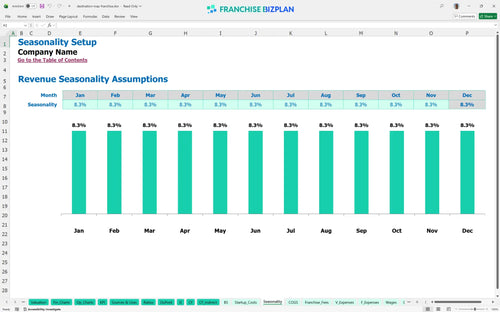
Researched revenue assumptions
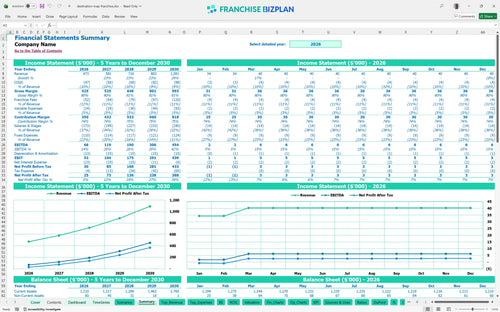
Lender-friendly financial outputs
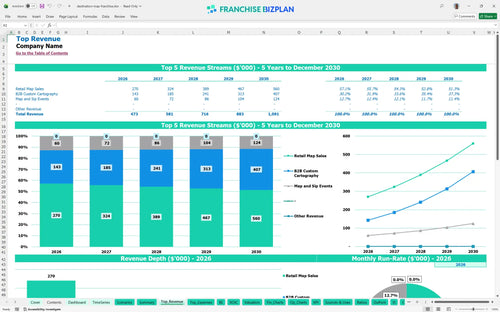
Revenue stream detailed view
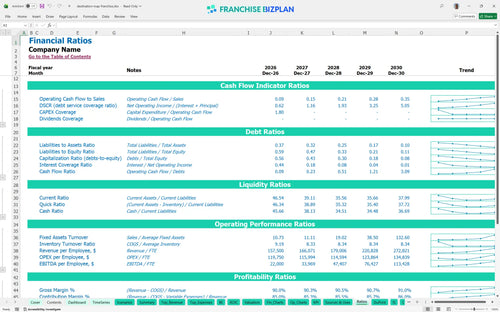
Performance metrics benchmark
We built this model using detailed research into the geographic artistry and boutique retail sector. The assumptions for revenue streams like Retail Map Sales and B2B Custom Cartography are pre-populated and fully editable, showing a Year 1 revenue of $473,000 and EBITDA of $66,000. This tool facilitates financial planning for creative retail franchise owners who need to manage specialized labor and on-site printing lab costs.
The unit reaches profitability in its first year, generating $66,000 in EBITDA. By Year 3, revenue is projected to hit $716,000 with EBITDA growing to $190,000 as you scale your retail franchise business plan. This assumes you manage the 11% total royalty and marketing burden while keeping printing materials around 7% of sales.
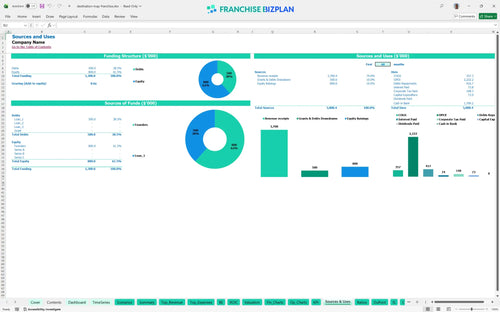
You need approximately $73,000 in capital expenditure planning to cover the $25,000 franchise fee, $20,000 buildout, and $15,000 printing lab. This startup expense breakdown for small retail franchise also includes $8,000 for tech and $5,000 for initial inventory. Plus, you will need to cover $9,200 in monthly fixed costs like rent and insurance during the launch phase.
The franchise ROI calculation shows an Internal Rate of Return (IRR) of 9.15% and a Return on Equity (ROE) of 1.05. With a 2-year payback period, the model suggests a relatively efficient recovery of your initial $73,000 investment. This performance relies on hitting the Year 5 revenue target of $1,091,000 while maintaining a healthy net margin.
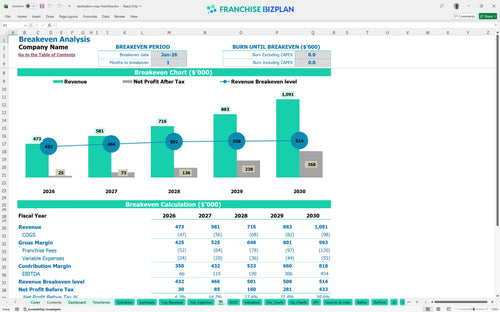
The unit hits the break-even point in January 2026, just one month after opening its doors. This rapid start is driven by high-margin B2B custom work and the immediate launch of retail map sales. When estimating operating costs for a gift shop franchise, remember that volume is the primary lever to offset the 10% royalty fee.
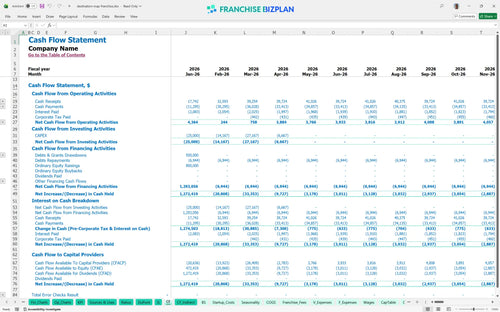
The franchise unit cash flow management template shows the lowest cash point occurs in January 2027 with a balance of $1,183,000. This massive buffer suggests a very low risk of insolvency during the ramp-up period. Still, you should monitor the $9,200 monthly fixed burn to ensure your cash runway remains secure if sales growth slows down.
Profitability forecasting for new franchise units varies based on your ability to drive traffic and manage labor. In a high-growth scenario, Year 5 EBITDA could exceed the projected $454,000 if B2B custom cartography takes off. Use the franchise investment calculator to toggle revenue and expense assumptions to see how they impact your peak cash needs and overall ROI. Finance: update unit break-even and payback model by Friday.
This franchise financial model template is built in Excel to give you total control over your numbers. You can adjust the pre-filled formulas and editable assumptions to match your specific territory, whether you are using it as a financial model template for boutique retail franchise or a standard shop. It is defintely the easiest way to test different pricing and volume scenarios before signing a lease or committing to a franchise startup costs spreadsheet.

Plan your growth with confidence using detailed 5-year revenue, cost, and cash flow projections. This tool tracks franchise unit performance metrics over time, allowing you to see how your operating expense forecast shifts as you scale from one unit to a small chain. You can monitor long-term profitability and balance sheet health to ensure your investment stays on track through the initial ramp-up and mature years.

This model simplifies the complex task of analyzing revenue streams for retail franchise locations by automatically calculating your ongoing obligations. It captures the 10% royalty fee and 1% marketing fund contribution based on your gross sales, ensuring you see the true net profit after all brand-level costs. By factoring in these recurring expenses, you can better understand the real-world economics of your agreement.

Learning how to calculate startup costs for a retail franchise is critical for managing your initial liquidity. This model uses a breakeven analysis template to show exactly when your monthly revenue covers your fixed costs, such as the $7,500 monthly rent. It maps out the path from your initial investment to the point where the unit generates enough cash to cover both fixed and variable expenses.

The model incorporates built-in benchmarks for key metrics like labor and occupancy to help you sanity-check your projections. Using this franchise unit profitability analysis, you can compare your expected gross margins and revenue drivers against typical industry ranges. This ensures your assumptions are realistic and helps you identify areas where you can improve efficiency to drive higher store-level EBITDA.


Simply purchase and download the financial model template, then access it instantly using Microsoft Excel or Google Sheets. No installation or technical expertise required-just open and start working.

Enter your business-specific numbers, including revenue projections, costs, and investment details. The pre-built formulas will automatically calculate financial insights, saving you time and effort.

Leverage the investor-ready format to confidently showcase your financial projections to banks, franchise representatives, or investors. Impress stakeholders with clear, data-driven insights and professional reports.

Leverage the investor-ready format to confidently present your projections to banks, franchise representatives, or investors.