
All-in-one Dashboard
Core inputs and core outputs


This franchise unit financial forecasting spreadsheet provides a complete roadmap for projecting revenue, managing expenses, and calculating total investment for a new sports equipment territory.
Core inputs and core outputs
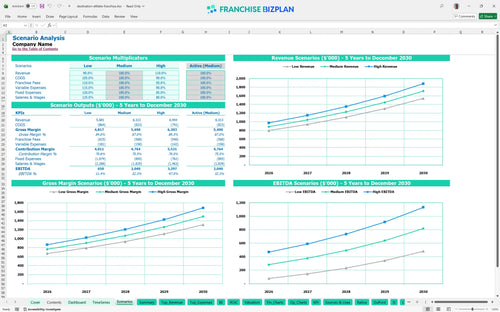
Three scenario analysis
Presentation ready
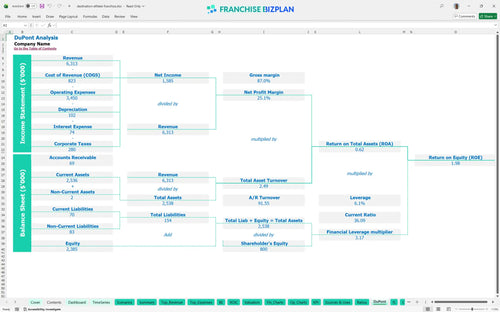
DuPont analysis
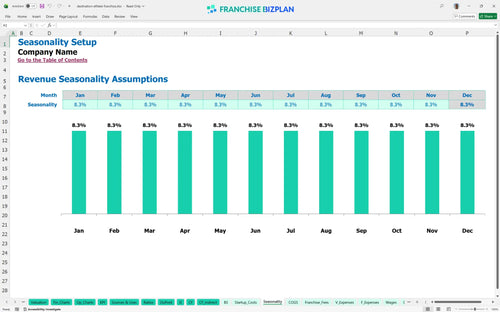
Researched revenue assumptions
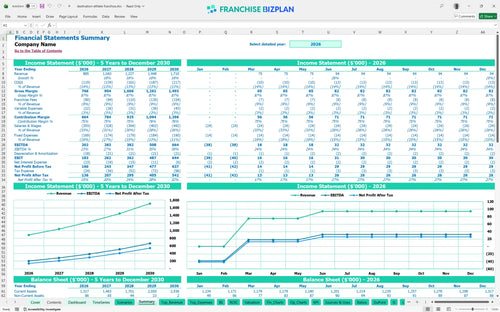
Lender-friendly financial outputs
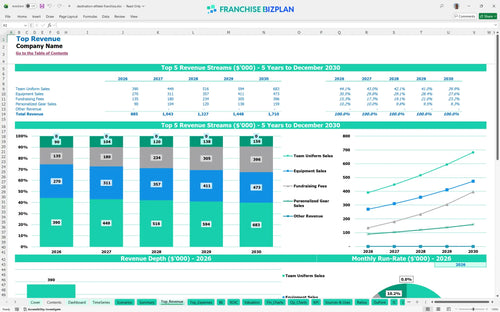
Revenue stream detailed view
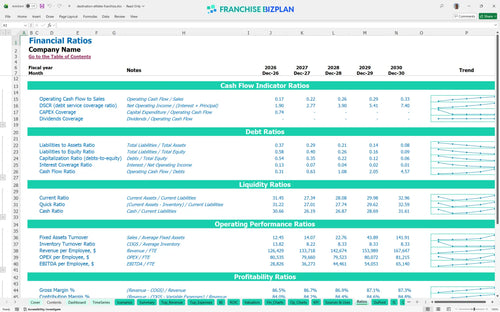
Performance metrics benchmark
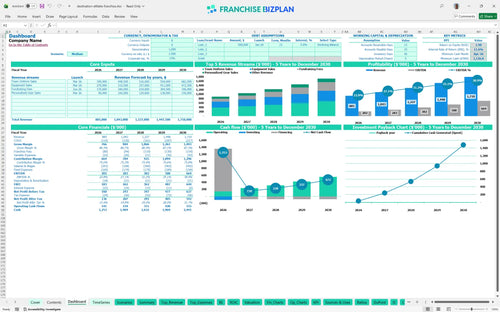
We built this business model for sports equipment and uniform franchise using deep research into the youth athletics market. All assumptions for revenue streams like team uniforms and fundraising fees are pre-populated and ready for you to tweak. With a year-one EBITDA of $202,000 and revenue of $885,000, the model shows how a disciplined operator can turn a healthy profit by focusing on high-volume accounts.
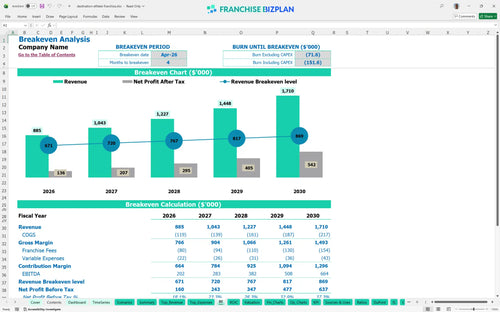
Profitability hits fast in this model, with the unit reaching break-even by April 2026. By year five, you are looking at an EBITDA of $664,000, which will defintely improve your franchise profitability analysis as you scale.
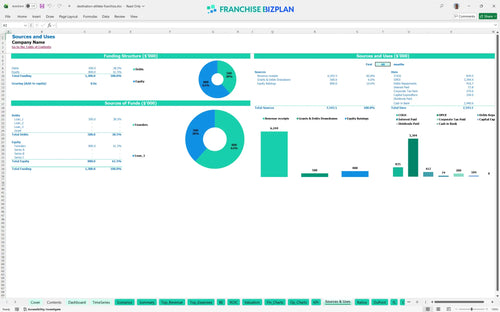
To launch this unit, you need to understand how to calculate startup costs for a sports franchise. Your major uses of capital include a $50,000 franchise fee and $18,000 for leasehold improvements, totaling over $104,000 in early CapEx.
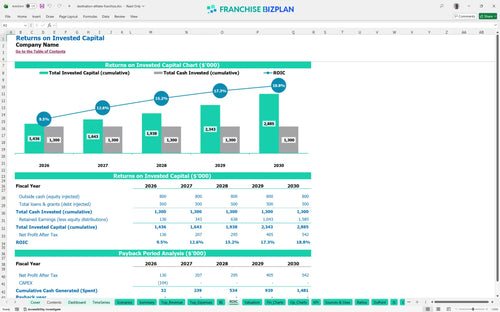
Your return on investment calculation shows an IRR of 11.55% and an ROE of 1.98. While the payback period extends after year five, the steady climb in revenue to $1.71M suggests a strong long-term asset for any financial feasibility study for retail sports franchise owners.
Monthly break-even occurs in April 2026, just four months after launch. Reaching this point depends heavily on estimating revenue for youth sports apparel business contracts, specifically hitting your $260,000 year-one uniform sales target.
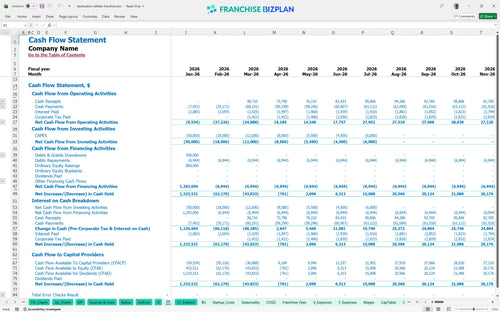
Your lowest cash point is $1,127,000 in April 2026, which includes your initial investment and ramp-up losses. Planning operational expenses for a new franchise location requires a buffer, so keep an eye on your inventory levels during the off-season.
This franchise investment analysis tool lets you toggle between scenarios to see how a 10% revenue swing affects your cash. In the high case, aggressive local marketing and better sales associate productivity can push your year-one margin significantly higher.
Finance: update unit break-even and payback model by Friday.
This franchise financial model template is built in Excel to give you total control over your numbers. You can swap out pre-filled formulas and adjust assumptions to fit your specific territory or local market conditions without needing a degree in finance.

Planning for the long haul requires a sports franchise business plan that looks past the first season. This model delivers a 5-year view of your revenue, cash flow, and balance sheet to help you see how your retail franchise financial projections evolve as you scale from one school contract to a whole district.

Managing the franchise royalty fee structure is critical for maintaining store-level margins. The tool tracks your 7% royalty and 2% marketing fund contributions automatically, ensuring you know exactly how much of your $885,000 year-one revenue stays in your pocket after the franchisor takes their cut.

You need to know your franchise unit startup costs before signing a lease. This section provides a detailed break-even analysis, mapping out your initial $50,000 franchise fee and other capital expenditure planning to find the exact sales volume needed to cover your $9,000 monthly rent.

Don't guess on your operating expense forecasting. We've baked in industry benchmarks for labor and occupancy so you can see if your 11.5% COGS or your staffing plan aligns with successful units in the youth sports apparel space.


Simply purchase and download the financial model template, then access it instantly using Microsoft Excel or Google Sheets. No installation or technical expertise required-just open and start working.

Enter your business-specific numbers, including revenue projections, costs, and investment details. The pre-built formulas will automatically calculate financial insights, saving you time and effort.

Leverage the investor-ready format to confidently showcase your financial projections to banks, franchise representatives, or investors. Impress stakeholders with clear, data-driven insights and professional reports.

Leverage the investor-ready format to confidently present your projections to banks, franchise representatives, or investors.