
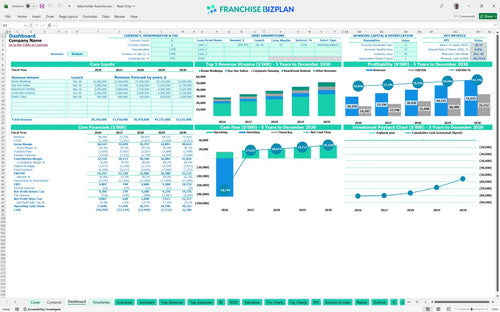
All-in-one Dashboard
Core inputs and core outputs


This hotel business plan template provides a complete Excel-based toolkit for forecasting revenue, managing large-scale CAPEX, and analyzing multi-year profitability for a hospitality asset.
Core inputs and core outputs
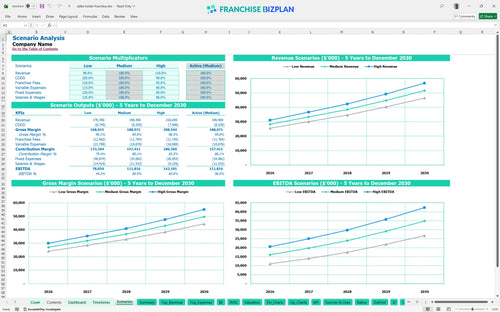
Three scenario analysis
Presentation ready
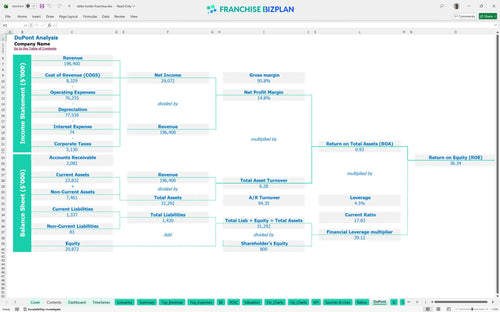
DuPont analysis
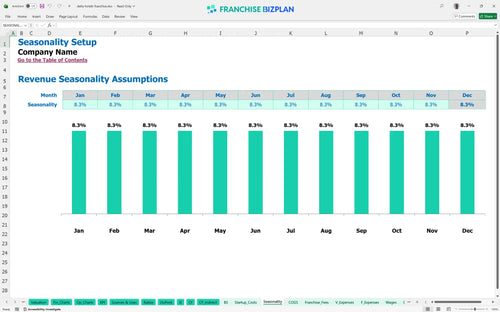
Researched revenue assumptions
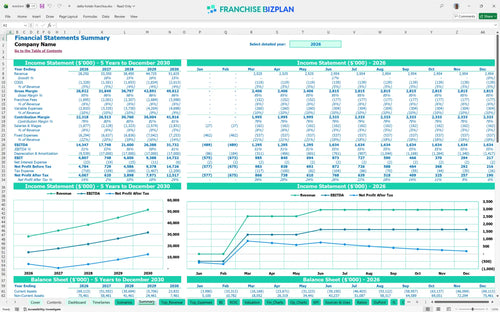
Lender-friendly financial outputs
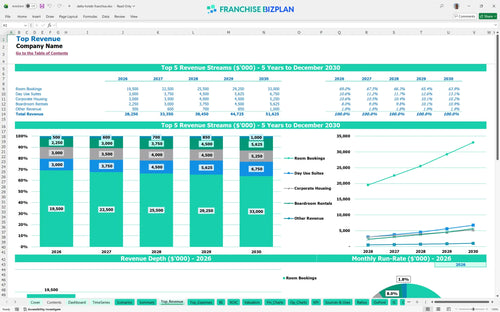
Revenue stream detailed view
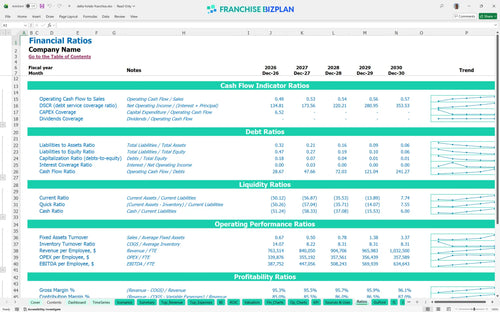
Performance metrics benchmark
We built this hotel franchise financial model using our own research to ensure it reflects the high-stakes reality of upscale hospitality. Key assumptions, including the $28.25 million year-one revenue and specific labor costs for front desk and housekeeping staff, are pre-populated and fully editable to match your territory. This franchise investment spreadsheet gives you a data-driven head start on your financial feasibility study for boutique hotel franchise or corporate units.
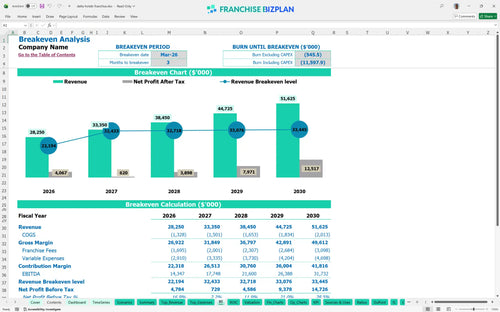
The unit reaches operational break-even quickly in March 2026, just three months after launch. While EBITDA is strong, starting at $14.3 million in year one, the high initial investment means true payback on equity happens after the five-year mark. Here's the quick math: you are trading high upfront CAPEX for significant annual cash flow and a projected revenue for corporate hotel franchise growth of 82% over five years.
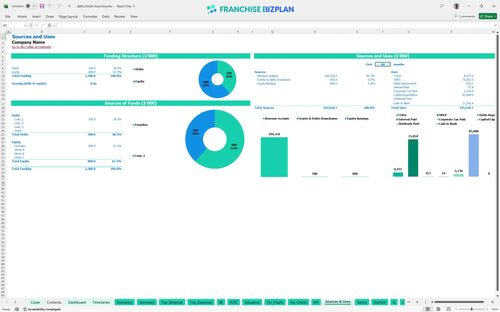
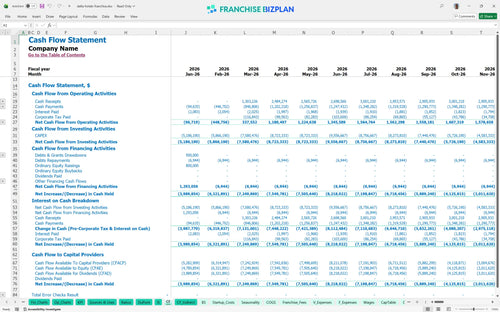
You need significant capital to get this off the ground, with the model showing a peak cash need of over $70.7 million. The bulk of this goes into the $45 million construction cost and $20 million for FF&E and public area finishes. This hotel startup cost calculator ensures you account for the $120,000 franchise fee and $4 million IT infrastructure before the first guest checks in.
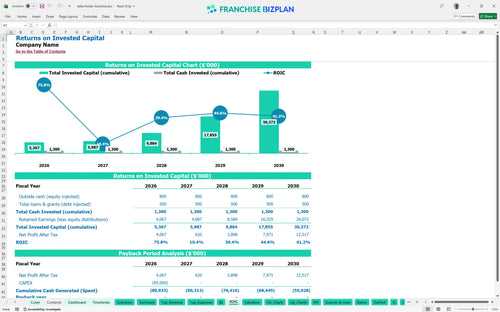
Investors can expect a Return on Equity (ROE) of 36.34, though the Internal Rate of Return (IRR) is a modest 0.78% due to the heavy $85M+ initial spend. Payback occurs after year 5, making this a long-term yield play rather than a quick flip. To be fair, the value is in the stabilized EBITDA which grows to $31.7 million by year five, proving how to calculate hotel franchise profitability over a full cycle.
Monthly break-even is achieved in March 2026, just 3 months after opening. The primary driver for hitting this target is room booking volume, which needs to hit the $13 million mark in the first year. Fixed costs like the $350,000 monthly property lease and $60,000 in property taxes create a high floor that requires steady hotel revenue management and occupancy.
The lowest cash point hits $70.7 million in December 2026, reflecting the massive construction and setup outlays. You will need a deep capital reserve or a phased loan draw to survive the ramp-up phase. If construction takes 90+ days longer than planned, the working capital pressure will rise significantly, making an Excel template for hotel franchise startup costs essential for monitoring.
A High scenario assumes better revenue management and higher corporate contract density, significantly improving the year-1 margin. Conversely, a Low scenario with 10% less revenue would push the lowest cash point even deeper and delay the 3-month break-even. This hotel business financial model for investors helps you visualize how a 1-point margin leak in labor or royalties affects your overall ROE.
This hotel franchise financial model is built in Excel so you can tweak every assumption to match your specific market. You can adjust room rates, occupancy targets, and labor costs without breaking the logic. It is defintely easier to test 'what-if' scenarios when the formulas are already doing the heavy lifting for you.

Mapping out a half-decade of performance helps you see the transition from construction to stabilized operations. The model tracks hospitality franchise financial projections from $28.25 million in year one to over $51.6 million by year five. This long-term view is vital for commercial real estate underwriting and keeping investors aligned on the exit strategy.

Operating under a major brand means paying for the flag through franchise royalty fees and marketing funds. This tool calculates the 5% royalty and 1% marketing fee automatically based on your gross room bookings and pantry sales. Knowing exactly how much goes to the franchisor helps you protect your store-level margin and perform a proper hotel franchise fee structure analysis.

Launching a full-service hospitality unit requires massive upfront capital, including $45 million for construction and $12 million for guest room furnishings. Our model identifies the break-even point-estimated at month 3-so you know when the unit starts covering its own monthly bills. Understanding these startup costs for full-service hotel franchise units prevents mid-project funding gaps.

Don't guess on your hotel operational expenses. The model includes benchmarks for housekeeping supplies, which start at 3.5% of revenue, and OTA commissions at 8.5%. Comparing your projections against these hospitality ROI analysis standards ensures your business plan stays grounded in reality and follows best practices for hotel franchise financial forecasting.


Simply purchase and download the financial model template, then access it instantly using Microsoft Excel or Google Sheets. No installation or technical expertise required-just open and start working.

Enter your business-specific numbers, including revenue projections, costs, and investment details. The pre-built formulas will automatically calculate financial insights, saving you time and effort.

Leverage the investor-ready format to confidently showcase your financial projections to banks, franchise representatives, or investors. Impress stakeholders with clear, data-driven insights and professional reports.

Leverage the investor-ready format to confidently present your projections to banks, franchise representatives, or investors.