
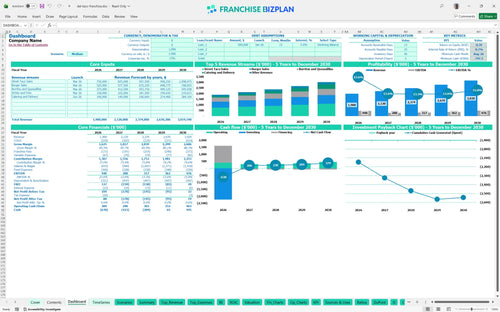
All-in-one Dashboard
Core inputs and core outputs


This franchise unit profitability spreadsheet for beginners includes dynamic tabs for revenue, labor, CAPEX, and full financial statements to guide your investment decision.
Core inputs and core outputs
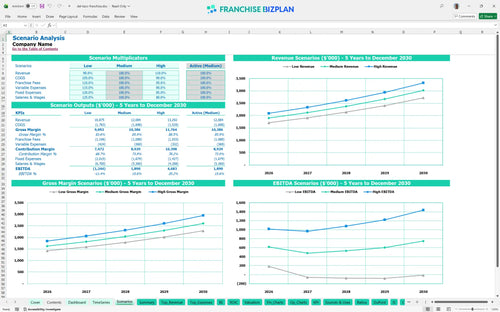
Three scenario analysis
Presentation ready
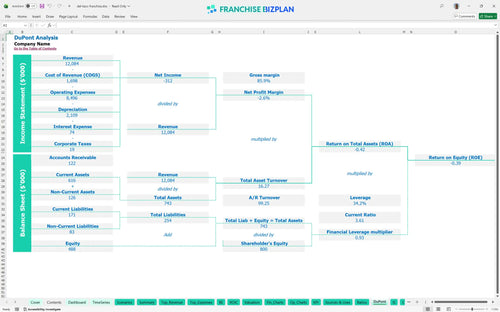
DuPont analysis
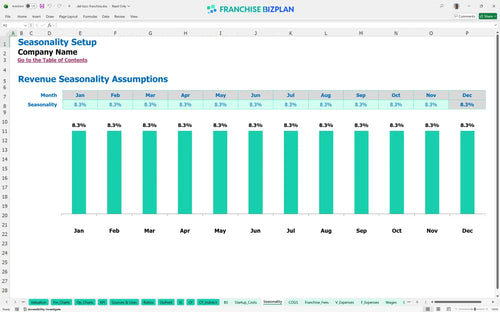
Researched revenue assumptions
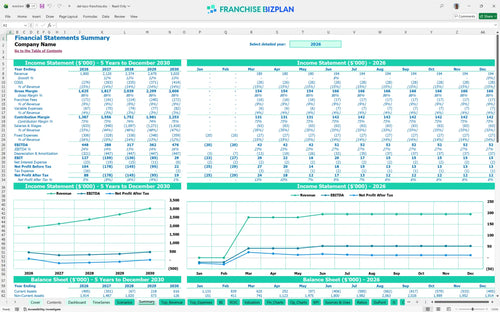
Lender-friendly financial outputs
Revenue stream detailed view
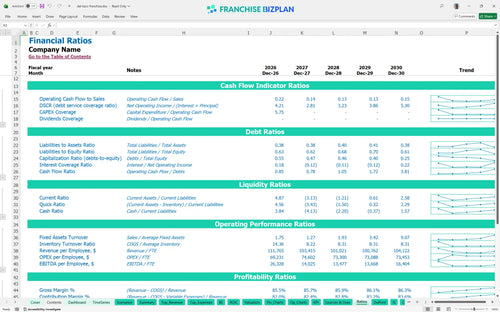
Performance metrics benchmark
We built this franchise unit financial model using our own research into high-volume Mexican-American QSR concepts. Key assumptions like the $1.9 million year-one revenue and the 9% combined royalty and marketing fee are pre-populated and fully editable. Here is the quick math: you are looking at a high-volume, 24-hour model that requires precise labor management to protect the $448,000 year-one EBITDA.
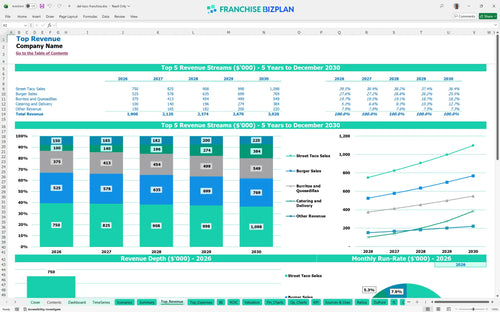
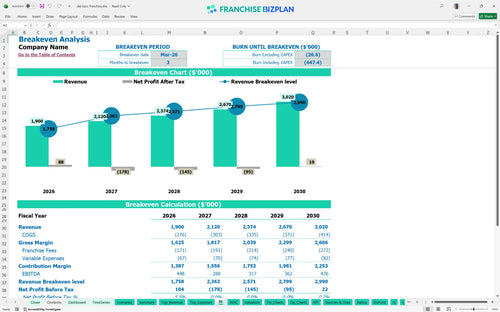
Based on our research, this unit hits monthly break-even by March 2026, just three months after opening. While Year 1 EBITDA starts strong at $448,000, the model shows a dip in Year 2 as staffing scales to meet a 24-hour operational cycle. You have to stay focused on the $500,000 street taco baseline to keep the lights on.
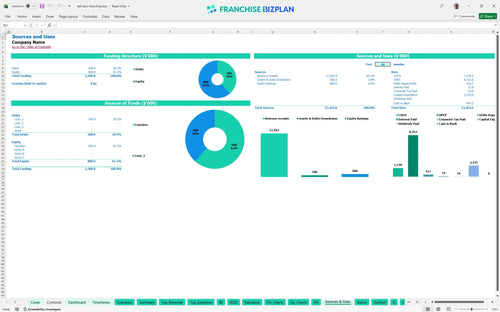
You will need a significant capital expenditure budget to get this location off the ground in the US. The total investment exceeds $2.2 million, covering everything from the $35,000 franchise fee to $950,000 in leasehold improvements for a modern facility. What this estimate hides is the timing of cash outlays before the first taco is ever sold.
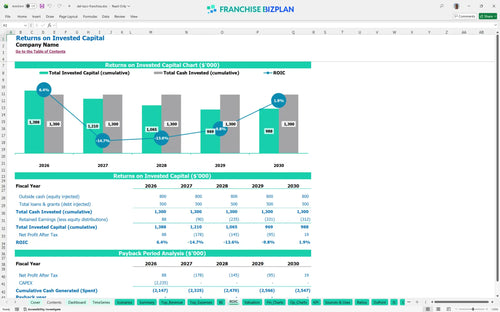
This is a long-term play, as the payback period extends beyond the first five years due to the heavy upfront infrastructure costs. With an IRR (internal rate of return) of -0.75% and a ROE (return on equity) of -0.39% in this specific scenario, your focus must be on driving high-volume throughput to turn the corner. Still, the $3 million revenue target in Year 5 shows the potential for significant scale.
To cover fixed costs like the $18,000 monthly rent and $4,200 in utilities, you need to hit your stride by month three. The primary driver here is volume, specifically from high-margin items like drinks and fries which are projected to start at $150,000 annually. If your opening takes 90+ days longer than planned, working capital pressure rises quickly.
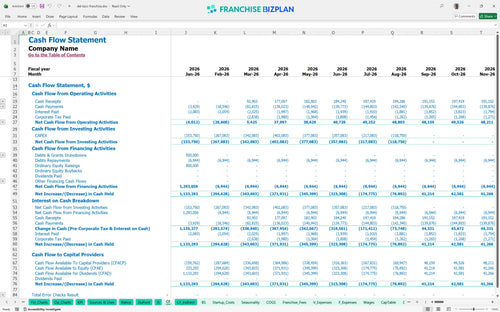
The lowest cash point hits in August 2026 at negative $797,000, which means you defintely need a robust working capital reserve or financing plan. Estimating labor costs for 24-hour restaurant operations is tricky, so keep a buffer for those early months of training and ramp-up. To be fair, the 24/7 model is a cash cow only if you manage the graveyard shift efficiently.
Our franchise profitability analysis looks at how a 10% drop in revenue or a spike in food costs changes your peak cash need. In a high-growth scenario where catering and delivery hit $384,160 by Year 5, your year-end EBITDA improves significantly, shortening the path to positive returns. How to project revenue for a new restaurant location depends entirely on your local marketing execution.
This franchise unit financial model template is built in Excel, allowing you to swap out every assumption from street taco volume to burger pricing. It uses pre-filled formulas so you can test different rent scenarios or labor spikes without breaking the logic. Honestly, having a flexible tool is the only way to handle the moving parts of a 24-hour operation.

Mapping out a QSR franchise business plan requires looking past the first year of honeymoon sales. This model provides a full 5-year view, showing how revenue scales from $1.9 million to over $3 million as your catering and delivery channels mature. We focus on the long game because your exit value depends on sustained cash flow, not just a lucky opening month.

Analyzing franchise royalty and marketing fees in Excel is critical because these off-the-top costs hit your margin every single week. We've baked in a 5% royalty and 4% marketing fund contribution to ensure your store-level EBITDA (earnings before interest, taxes, depreciation, and amortization) reflects the true cost of brand membership. It's about seeing the net cash that actually stays in your pocket.

Knowing how to calculate startup costs for a fast food franchise is the difference between a successful launch and a mid-build cash crunch. With over $2.2 million in initial capital needed for items like leasehold improvements and drive-thru tech, this break-even analysis for quick service restaurant franchise shows exactly when you stop burning cash. Every dollar spent on the build-out must be justified by future throughput.

We use unit economics from real-world QSR operations to set baseline targets for food and labor. If your food ingredients are trending above 12%, the model flags the variance so you can adjust portioning or vendor pricing to stay competitive. Comparing your unit against industry standards helps you spot margin leaks before they drain your bank account.


Simply purchase and download the financial model template, then access it instantly using Microsoft Excel or Google Sheets. No installation or technical expertise required-just open and start working.

Enter your business-specific numbers, including revenue projections, costs, and investment details. The pre-built formulas will automatically calculate financial insights, saving you time and effort.

Leverage the investor-ready format to confidently showcase your financial projections to banks, franchise representatives, or investors. Impress stakeholders with clear, data-driven insights and professional reports.

Leverage the investor-ready format to confidently present your projections to banks, franchise representatives, or investors.