
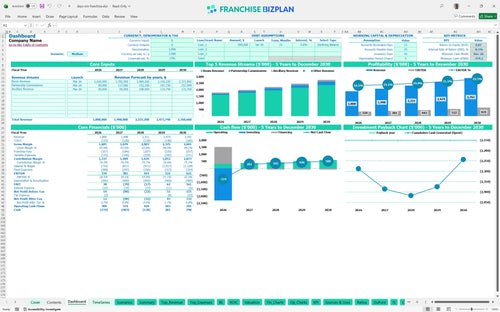
All-in-one Dashboard
Core inputs and core outputs


The financial model template for limited service hotel operations includes integrated calculators for room revenue, partnership commissions, and 5-year cash flow projections.
Core inputs and core outputs
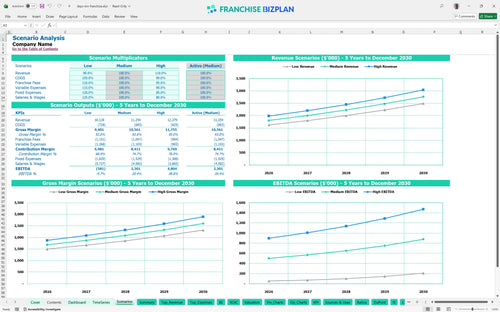
Three scenario analysis
Presentation ready
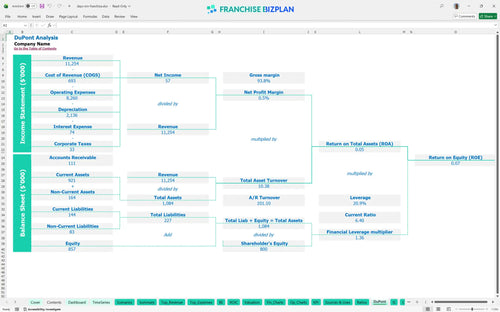
DuPont analysis
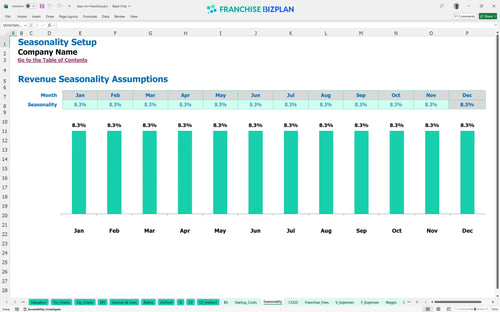
Researched revenue assumptions
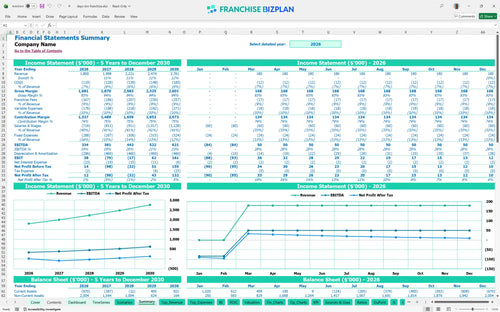
Lender-friendly financial outputs
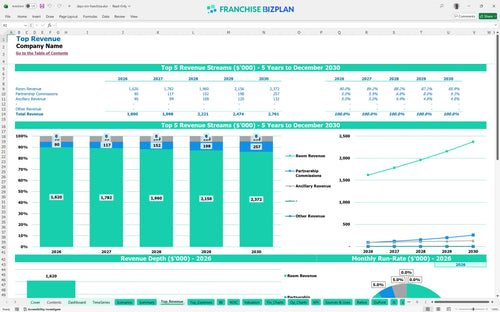
Revenue stream detailed view
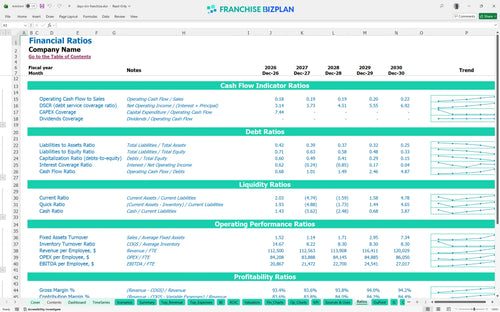
Performance metrics benchmark
We built this franchise unit financial model using our own research to provide a realistic view of a $1.8 million Year 1 revenue target and the associated 5.5% royalty burden. Key assumptions for estimating operating expenses for a franchise hotel unit are pre-populated and fully editable to match your specific territory and site selection.
The unit reaches operational profitability in its first year with a projected EBITDA of $334,000, scaling to $621,000 by Year 5. While the hotel franchise profit and loss statement template shows consistent growth, true net profitability accounts for the high initial $2.3 million investment and ongoing 3.8% marketing fees.
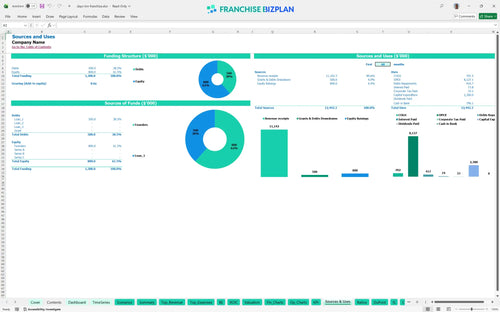
Launching this unit requires approximately $2.3 million in total capital, primarily allocated to property modernization and brand standards. This hotel franchise investment spreadsheet accounts for the $35,000 franchise fee and significant capital expenditure planning for guest room renovations and automated check-in kiosks.
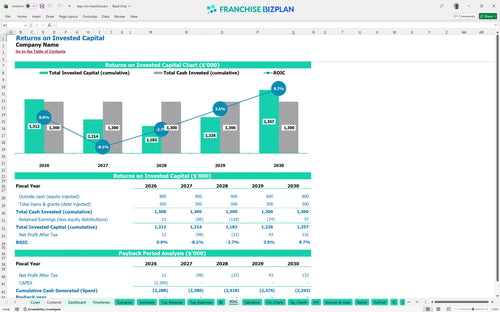
The hotel franchise ROI and cash flow analysis indicates a payback period occurring after Year 5, reflecting the heavy upfront renovation costs. With an IRR of -0.14 and an ROE of 0.07, this model highlights that evaluating franchise investment feasibility for hospitality requires a long-term horizon and disciplined expense management.
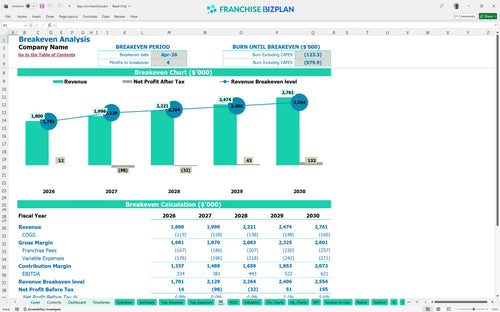
The unit hits its monthly break-even point in April 2026, just four months after launching, provided hotel occupancy rate projections stay on target. The primary driver for break-even is room revenue volume, which must cover $24,000 in monthly fixed costs including $10,000 for utilities and $4,000 in property taxes.
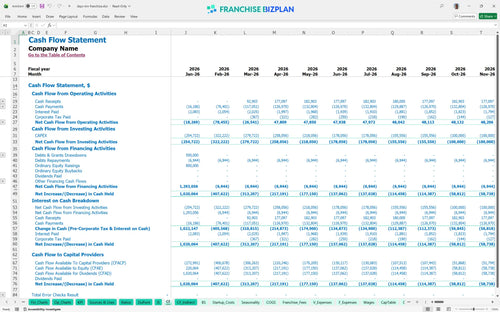
The lowest cash point occurs in December 2026 at -$774,000, signaling that you defintely need a robust working capital buffer beyond the initial build-out. This franchise financial forecasting spreadsheet for hotels suggests maintaining at least six months of fixed operating costs to handle seasonal dips in Orlando market demand.
The High scenario significantly improves the Year 1 $334,000 EBITDA by increasing room revenue and partnership commissions through better local marketing execution. Conversely, the Low scenario extends the payback period further beyond Year 5, emphasizing the importance of performing market demand analysis for hotel franchise locations before signing a lease.
Finance: update unit break-even and payback model by Friday.
This hotel franchise financial model is built in Excel with fully editable assumptions, allowing you to swap out room counts, seasonal rates, and local labor costs. The pre-filled formulas handle the heavy lifting, so you can focus on analyzing revenue potential for regional hotel franchise locations without building a spreadsheet from scratch.

Use this franchise business plan template to map out long-term growth with detailed projections for revenue, expenses, and store-level EBITDA. It provides a clear 5-year outlook on how room night sales and ancillary income streams evolve as you ramp up operations and stabilize your hospitality operational budget.

Managing the franchise royalty fee structure is critical for maintaining margins, and this model tracks the 5.5% royalty and 3.8% marketing fund contributions automatically. By isolating these brand-specific costs, you can see exactly how much cash remains for local debt service and owner distributions after meeting your brand obligations.

Our hotel startup cost calculator helps you visualize the $2.3 million initial investment, covering everything from the $35,000 franchise fee to $1.2 million in leasehold improvements. Knowing how to calculate startup costs for a hotel franchise is only half the battle; this tool also identifies the exact month your RevPAR forecasting covers your fixed overhead.

This hotel franchise investment spreadsheet includes built-in benchmarks for labor, utilities, and maintenance to ensure your projections stay grounded in reality. Comparing your estimated operating expenses for a franchise hotel unit against industry standards helps you identify margin leaks in categories like housekeeping wages or complimentary breakfast costs.


Simply purchase and download the financial model template, then access it instantly using Microsoft Excel or Google Sheets. No installation or technical expertise required-just open and start working.

Enter your business-specific numbers, including revenue projections, costs, and investment details. The pre-built formulas will automatically calculate financial insights, saving you time and effort.

Leverage the investor-ready format to confidently showcase your financial projections to banks, franchise representatives, or investors. Impress stakeholders with clear, data-driven insights and professional reports.

Leverage the investor-ready format to confidently present your projections to banks, franchise representatives, or investors.