
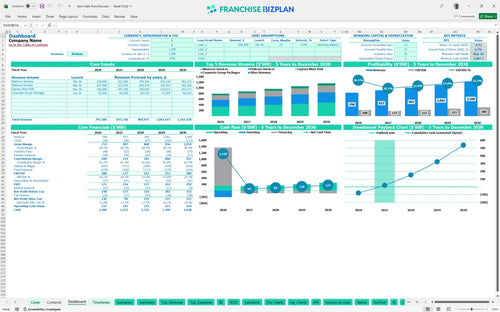
All-in-one Dashboard
Core inputs and core outputs


This Excel template for franchise unit financial projections includes everything from dynamic revenue drivers and payroll calculators to detailed CAPEX schedules and 5-year pro forma statements.
Core inputs and core outputs
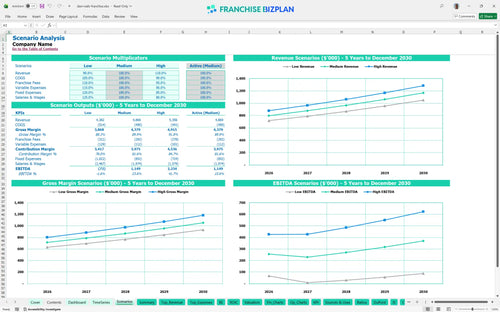
Three scenario analysis
Presentation ready
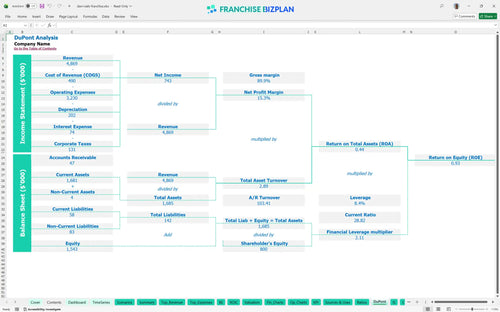
DuPont analysis
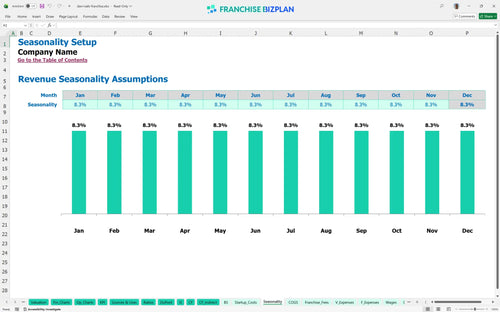
Researched revenue assumptions
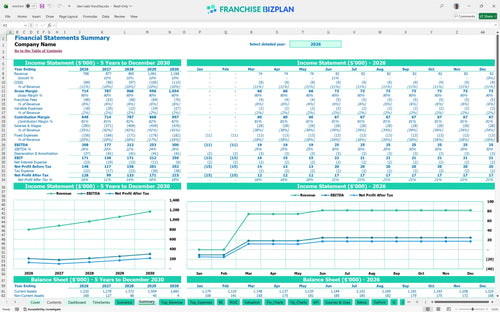
Lender-friendly financial outputs

Revenue stream detailed view
Performance metrics benchmark
We built this franchise financial model using our own research on high-traffic retail salon units. Key assumptions like the $798,000 year-one revenue target and 6% royalty fees are pre-populated and fully editable to match your specific territory. This tool helps you evaluate franchise business investment opportunities with real-world data on staffing, rent, and supply costs.
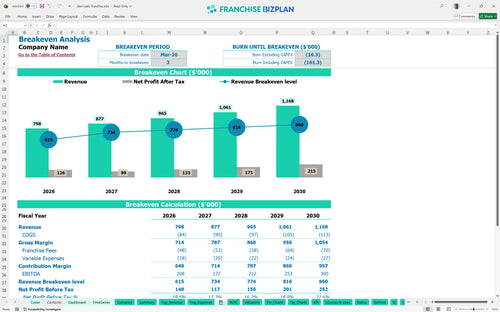
This nail salon franchise unit is projected to reach profitability in March 2026, just three months after launching. The model accounts for all operating expenses, including the $68,000 manager salary and 6% royalty, to show you the true net profit trajectory.
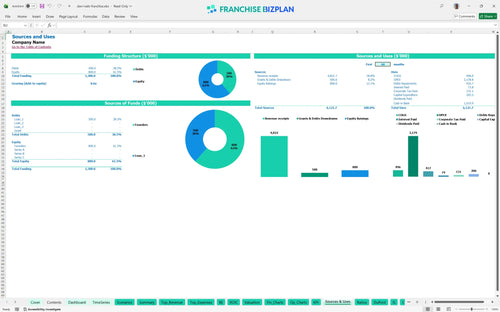
You will need approximately $205,500 to launch this unit in the US. This covers the $105,000 franchise fee, $35,000 for leasehold improvements, and $28,000 for essential equipment like chairs and stations. It also includes a buffer for pre-opening costs and initial marketing.
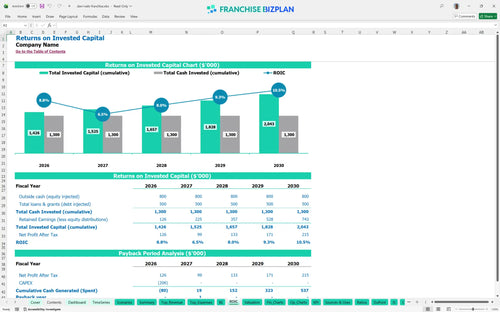
Investors can expect an Internal Rate of Return (IRR) of 6.72% and a Return on Equity (ROE) of 0.93. Based on the projected cash flows and initial investment, the full payback period for this franchise unit is estimated at 2 years.
The monthly break-even point occurs in March 2026. The most significant driver for reaching this point is service volume, specifically maintaining high traffic for manicure and pedicure services to cover the $9,500 monthly rent and $11,000+ in monthly management salaries.
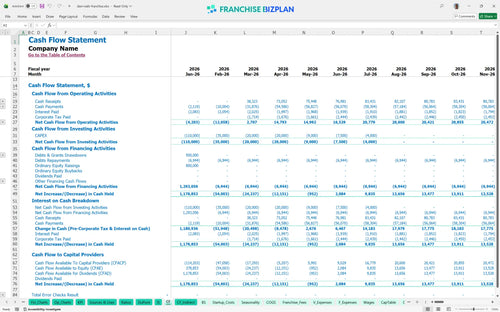
The lowest cash point is projected to be $1,088 in May 2026. While the model shows a quick ramp-up, having a small additional cash buffer is recommended to handle any delays in the June corporate group package launch.
The model compares Low, Medium, and High scenarios to show how a 10% shift in revenue or labor costs impacts your bottom line. In the High case, year-one EBITDA can exceed $208,000, significantly shortening the payback period and increasing the year-5 margin.
Finance: update unit break-even and payback model by Friday.
This franchise financial model is built entirely in Excel, giving you total control over every variable. You can adjust the pre-filled formulas and editable assumptions to fit your specific market, whether you are looking at a single nail salon franchise unit or planning a multi-unit rollout. It defintely simplifies the complex math of retail unit economics.

Planning for the long haul is easier with detailed 5-year projections for revenue, costs, and cash flow. This model helps you see how scaling from $798,000 in year one to over $1.1 million by year five impacts your bottom line. It provides a clear view of how store-level EBITDA evolves as the business matures.

Managing your obligations to the franchisor is critical for maintaining your store-level margin. The model tracks the 6% royalty fee and initial franchise fees so you can see exactly how much cash stays in the business. It helps you understand the real cost of brand support and marketing fund contributions over time.

Starting a new retail business plan template requires a clear view of your total initial investment. This tool breaks down everything from the $35,000 build-out to the $28,000 equipment package. You will know exactly what sales volume is needed each month to cover your fixed costs like the $9,500 monthly rent.

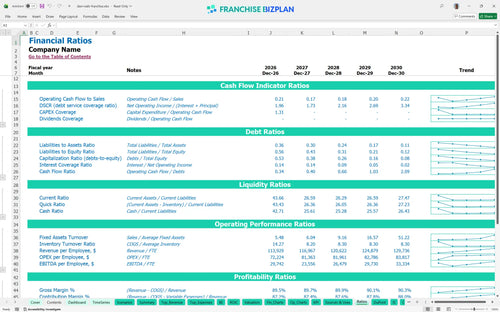
We have included industry-standard benchmarks for salon unit economics to help you sanity-check your numbers. You can compare your labor costs and supply expenses against typical franchise profitability analysis figures. This ensures your projections for things like nail supplies, which start at 9% of sales, stay within a realistic range.


Simply purchase and download the financial model template, then access it instantly using Microsoft Excel or Google Sheets. No installation or technical expertise required-just open and start working.

Enter your business-specific numbers, including revenue projections, costs, and investment details. The pre-built formulas will automatically calculate financial insights, saving you time and effort.

Leverage the investor-ready format to confidently showcase your financial projections to banks, franchise representatives, or investors. Impress stakeholders with clear, data-driven insights and professional reports.

Leverage the investor-ready format to confidently present your projections to banks, franchise representatives, or investors.