
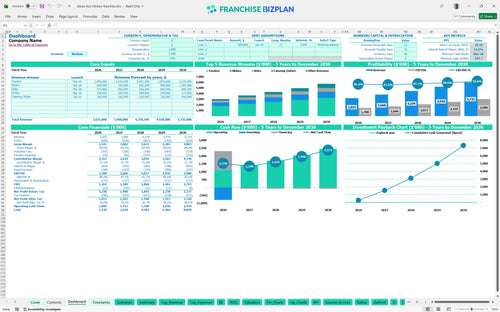
All-in-one Dashboard
Core inputs and core outputs


This restaurant franchise P&L statement template Excel includes dynamic revenue drivers, a comprehensive capital expenditure budget, and detailed operating expense projections for five years of growth.
Core inputs and core outputs
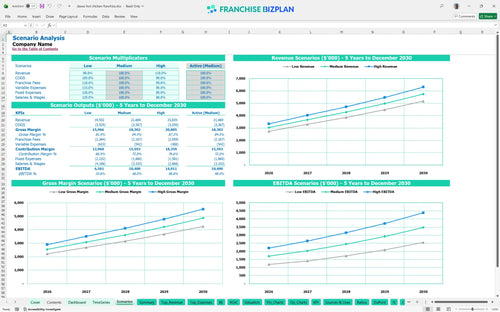
Three scenario analysis
Presentation ready
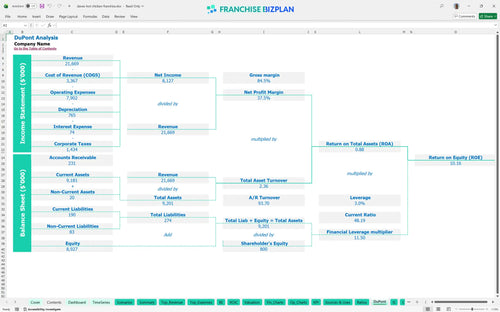
DuPont analysis
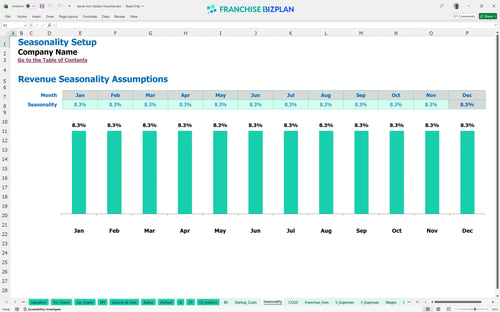
Researched revenue assumptions
Lender-friendly financial outputs
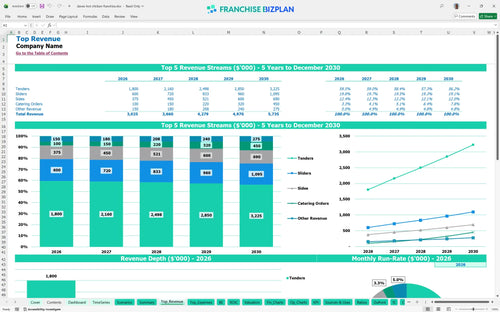
Revenue stream detailed view
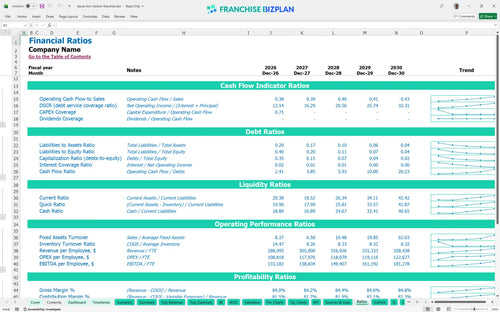
Performance metrics benchmark
We built this franchise unit financial model using our own research to help you navigate the high-volume chicken market. Key assumptions like the $1.39 million year-one EBITDA and the $20,000 monthly rent are pre-populated and fully editable to match your specific site. This tool provides the clarity needed to move from a prospect to a confident operator.
This franchise unit profitability analysis shows year 1 EBITDA of $1,398,000, scaling to $2,900,000 by year 5 as revenue grows from $3,025,000 to $5,735,000. Net profit accounts for 14% chicken costs and 10% combined franchise fees. Efficiency is the engine of your profit growth.
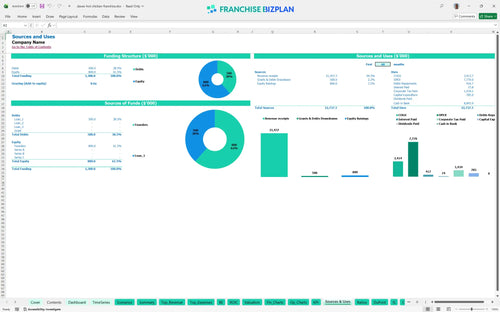
Launching this unit requires a capital expenditure budget of approximately $785,000 to cover the initial fee and build-out. This restaurant franchise startup costs estimate includes $350,000 for leasehold improvements and $220,000 for kitchen equipment. Cash is king during the build-out phase.
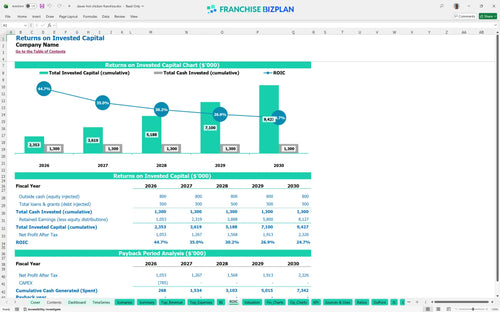
When analyzing return on investment for franchise locations, this model projects an IRR of 14.18% and an ROE of 10.16%. While the high initial investment means payback occurs after year 5, the strong annual cash flow supports a healthy multi-unit expansion strategy. Patience pays off in high-volume fast casual.
The break-even point analysis indicates the unit becomes self-sustaining in March 2026, just three months after opening. This relies on maintaining high volume for tenders and sliders while keeping fixed costs like the $20,000 monthly rent under control. Speed to break-even reduces your total risk profile.
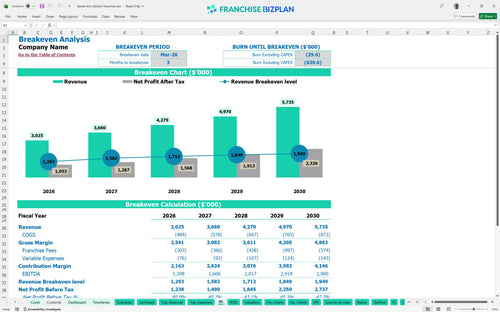
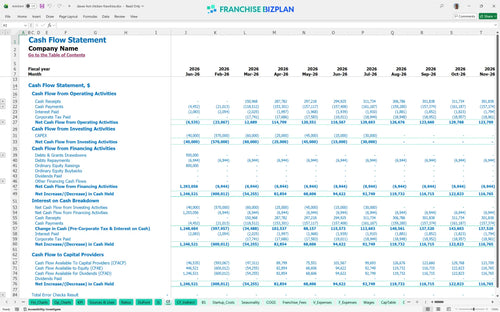
The lowest cash point hits $592,000 in March 2026, highlighting the need for a solid opening buffer. Creating a budget for a new fast food franchise location requires accounting for these early months where outflows for labor and utilities precede peak revenue. A thin cash buffer is a recipe for stress.
Preparing financial projections for restaurant franchise loan application involves testing how a 5% drop in traffic or a spike in chicken prices impacts the bottom line. The model compares different operating expense projections to ensure you can survive a low scenario without missing royalty payments. Scenarios are your financial fire drill.
Finance: update unit break-even and payback model by Friday.
This franchise financial model template is built in Excel to give you total control over your unit economics. You can adjust pre-filled formulas and editable assumptions to match your specific territory, whether you are looking at a high-traffic campus spot or a suburban strip. This is defintely the fastest way to stress-test your assumptions before signing a lease.

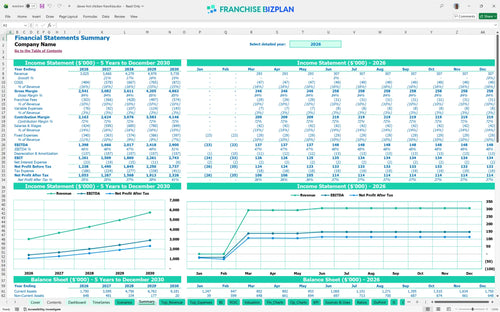
Planning for a single unit is one thing, but long-term survival requires a 5-year view of your P&L. This model provides detailed revenue forecasting for high-traffic restaurant franchise units, showing how your bottom line evolves as the brand matures. Long-term planning beats short-term guessing every single time.

Operating a franchise means managing specific financial obligations that can eat into your margins if you aren't careful. This tool simplifies understanding franchise royalty and marketing fund fees by calculating the 6% royalty and 4% brand fund automatically. Your margin is what's left after the brand takes its cut.

Knowing how to calculate startup costs for a fast-casual franchise is the difference between a smooth launch and a cash crunch. This model maps out your total initial investment, including the $350,000 for leasehold improvements and $220,000 for kitchen equipment. If you don't know your break-even, you don't know your risk.

We included built-in benchmarks so you can see if your labor or food costs are out of line with industry standards. This helps you follow best practices for managing franchise unit operating expenses by comparing your projections against typical fast-casual performance. Benchmarks keep your ego in check and your bank account full.


Simply purchase and download the financial model template, then access it instantly using Microsoft Excel or Google Sheets. No installation or technical expertise required-just open and start working.

Enter your business-specific numbers, including revenue projections, costs, and investment details. The pre-built formulas will automatically calculate financial insights, saving you time and effort.

Leverage the investor-ready format to confidently showcase your financial projections to banks, franchise representatives, or investors. Impress stakeholders with clear, data-driven insights and professional reports.

Leverage the investor-ready format to confidently present your projections to banks, franchise representatives, or investors.