
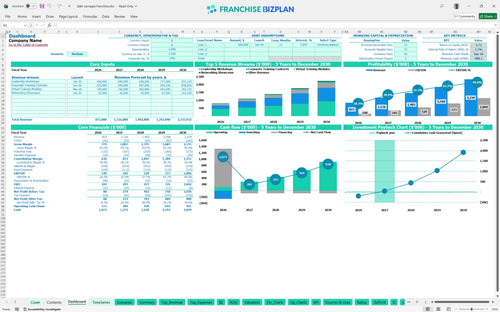
All-in-one Dashboard
Core inputs and core outputs


This franchise unit financial model template includes 5-year projections, a startup cost calculator, and detailed unit economics for a professional development business.
Core inputs and core outputs
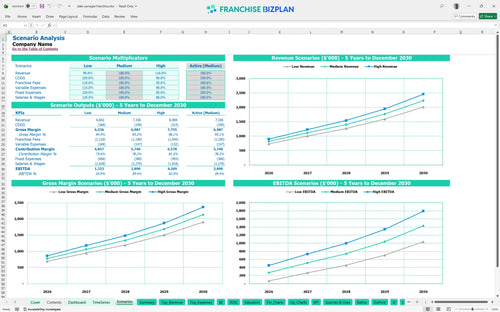
Three scenario analysis
Presentation ready
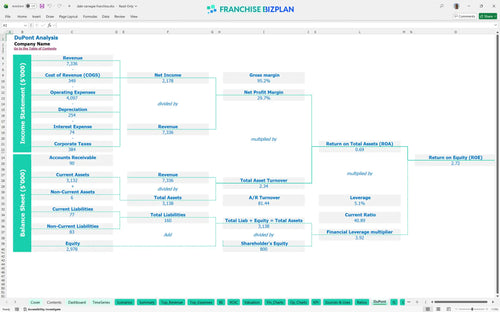
DuPont analysis
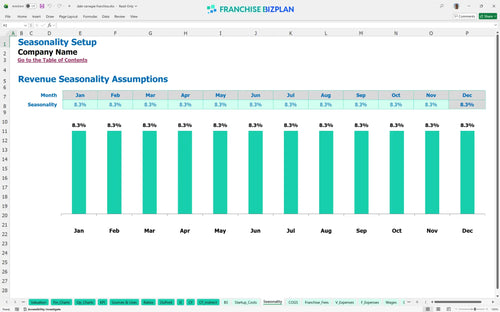
Researched revenue assumptions
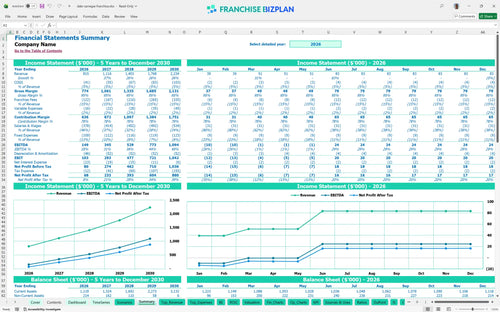
Lender-friendly financial outputs
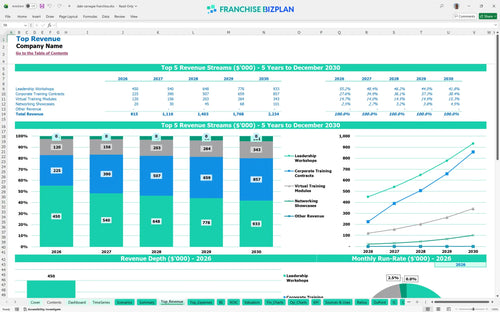
Revenue stream detailed view
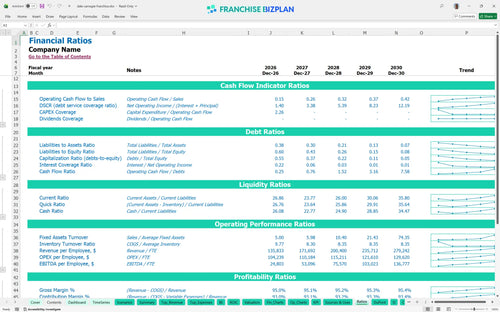
Performance metrics benchmark
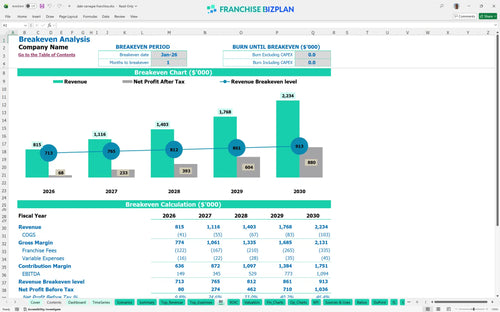
We built this franchise unit financial model using our own research into the professional development sector. Key assumptions, including the $65,000 franchise fee and Year 1 revenue of $815,000, are pre-populated with researched data specific to Dale Carnegie Franchise franchise unit and are fully editable. This financial template for B2B service-based franchise operations helps you visualize a path to $1.09M EBITDA by Year 5.
The unit hits profitability almost immediately, with a break-even date in January 2026. By Year 2, revenue scales to $1,116,000, helping you move past the initial setup phase quickly. This is defintely the best Excel model for franchise unit profitability because it tracks the 15% combined fee load against your margins.
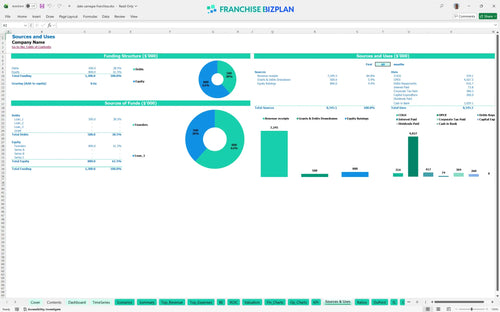
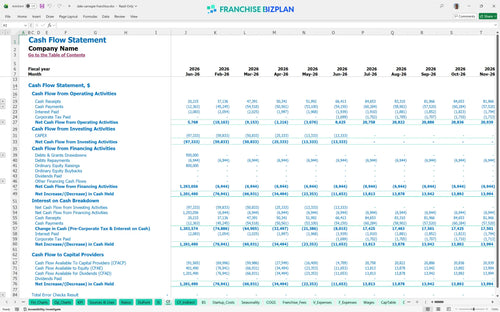
Total startup capital requirements are approximately $260,000. This covers the $65k franchise fee, $80k in leasehold improvements, and $35k for AV systems. Your lowest cash point is $988,000 in June 2026, so you need to watch your liquidity during the first six months.
Investors can expect an IRR of 7.7% and a 2-year payback period. The ROI analysis shows a Return on Equity of 2.72 as the unit matures. Use this franchise investment return calculator for owners to see how Year 5 EBITDA of $1.09M impacts your exit valuation.
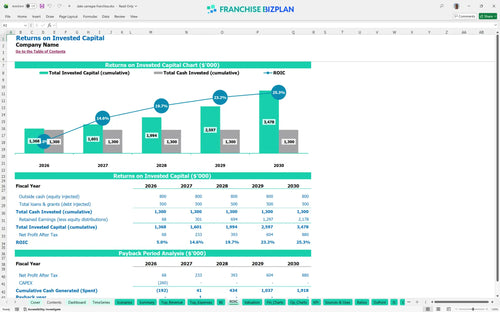
Monthly break-even is achieved in month 1. The key driver is the high margin on Leadership Workshops, which start at $300,000 annually. Knowing how to create a cash flow forecast for a franchise unit helps you manage the $5,000 monthly rent and $1,500 marketing spend.
The cash runway is protected by a quick break-even, but the minimum cash point of $988,000 in June 2026 is critical. Evaluating ongoing operational costs for franchise locations, like the $85,000 Center Director salary, ensures you don't over-hire before revenue catches up.
The model compares Low, Medium, and High scenarios to stress-test your franchise investment analysis. A high-performing unit can reach $2.23M in revenue by Year 5 with a 49% EBITDA margin. Improving sales executive productivity is the fastest way to hit those high-case numbers.
This franchise financial model template is a fully editable Excel tool designed for professional service units. You can adjust every revenue driver and expense line in this franchise business plan Excel to match your specific territory, whether you are scaling one location or planning a multi-unit rollout.

Success in professional development requires long-term operational expense forecasting. This model provides a 5-year view where revenue grows from $815,000 to over $2.2M, allowing you to see how your franchise profitability model evolves as you secure larger corporate contracts and scale your trainer team.

This model manages the complex math of franchise royalty fees and marketing fund contributions. It tracks the 12% royalty and 3% marketing fee against your gross sales, providing a clear view of estimating franchise royalty and marketing fees to ensure your local margins remain healthy.

Planning your entry requires a precise franchise startup cost calculator. This tool helps you figure out how to calculate startup costs for a training franchise, covering everything from the $65,000 initial fee to leasehold improvements, ensuring you know exactly when the unit hits its break-even sales target.

We've included industry standards to help with your financial feasibility study for professional development franchise locations. By understanding franchise unit economics for business planning, you can compare your $5,000 rent and staffing costs against typical B2B service benchmarks to ensure your model is realistic.


Simply purchase and download the financial model template, then access it instantly using Microsoft Excel or Google Sheets. No installation or technical expertise required-just open and start working.

Enter your business-specific numbers, including revenue projections, costs, and investment details. The pre-built formulas will automatically calculate financial insights, saving you time and effort.

Leverage the investor-ready format to confidently showcase your financial projections to banks, franchise representatives, or investors. Impress stakeholders with clear, data-driven insights and professional reports.

Leverage the investor-ready format to confidently present your projections to banks, franchise representatives, or investors.