
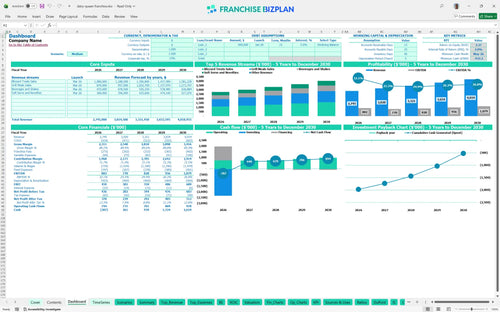
All-in-one Dashboard
Core inputs and core outputs


This financial model for multi-unit quick service restaurant operations includes detailed CAPEX schedules, 60-month P&L statements, and automated cash flow tracking.
Core inputs and core outputs
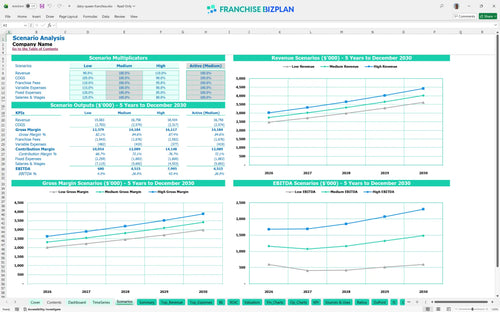
Three scenario analysis
Presentation ready
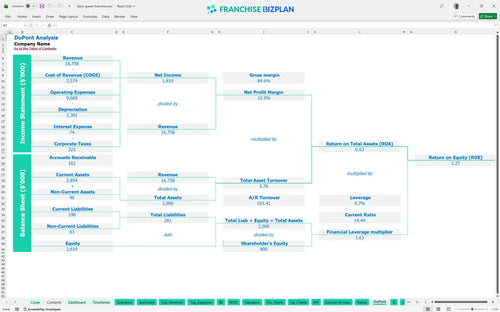
DuPont analysis
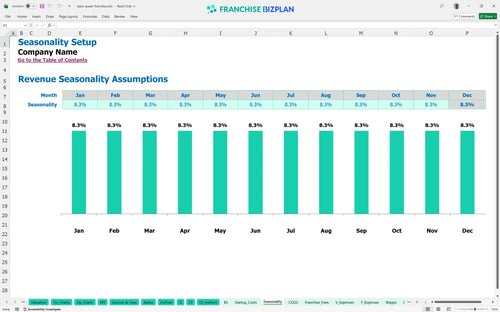
Researched revenue assumptions
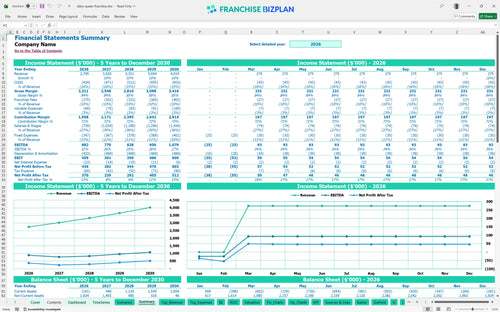
Lender-friendly financial outputs
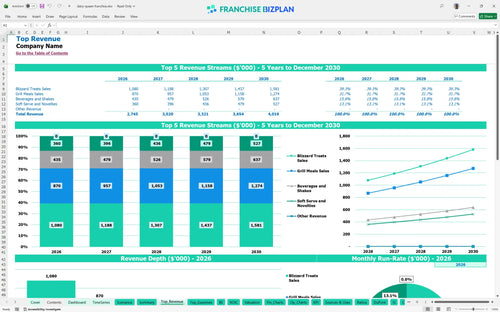
Revenue stream detailed view
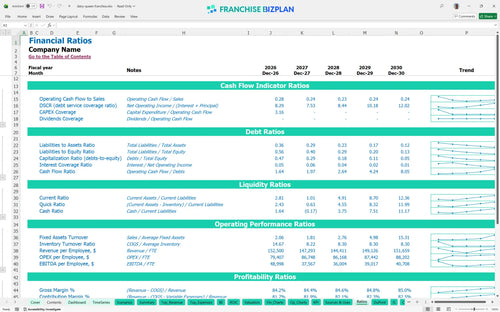
Performance metrics benchmark
We built this franchise unit financial model using our own research into high-volume treat and grill concepts. Key assumptions, including the $2.7M year-one revenue and 10% combined royalty and marketing fees, are pre-populated in this franchise investment feasibility study template and are fully editable. This tool helps you move past the marketing fluff and look at the hard numbers of running a store.
The unit becomes operationally profitable in Year 1 with an EBITDA (earnings before interest, taxes, depreciation, and amortization) of $882,000. While cash flow is positive early, the high initial investment means you are playing a long game for a full return. Profit is a marathon, not a sprint.
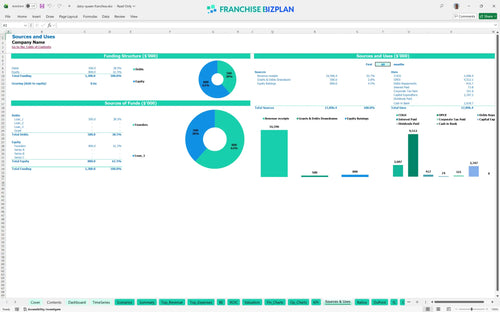
You need approximately $2,347,230 in startup capital, with $1,200,000 allocated to leasehold improvements and $600,000 for kitchen and treat equipment. This capital expenditure budget also accounts for a $27,230 franchise fee and a significant cash dip during the first few months of ramp-up. Cash is king, especially during build-out.
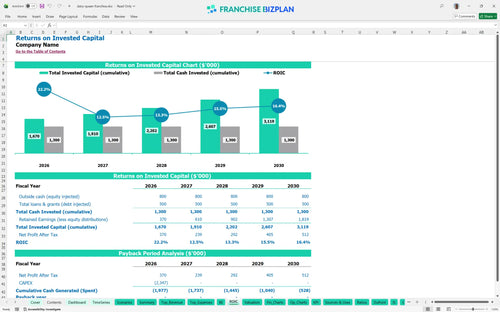
Based on the current model, the internal rate of return (IRR) is 2.04% with a return on equity (ROE) of 2.27%. Because of the $2.3M initial cost, the payback period extends beyond 5 years, which is defintely a factor for multi-unit operators to consider. Patience is required for high-CAPEX units.
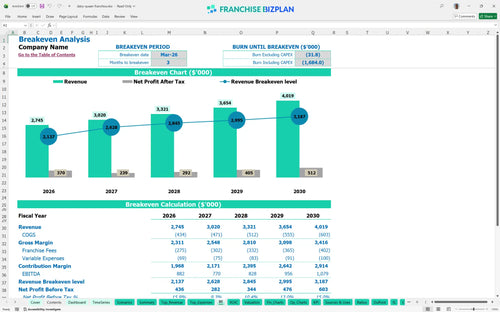
The unit reaches its monthly break-even point in March 2026, just three months after opening. To cover the $20,000 monthly rent and $270,000+ in annual management salaries, revenue forecasting for high-volume drive-thru franchises suggests you must maintain high traffic from day one. Volume cures almost every financial ill.
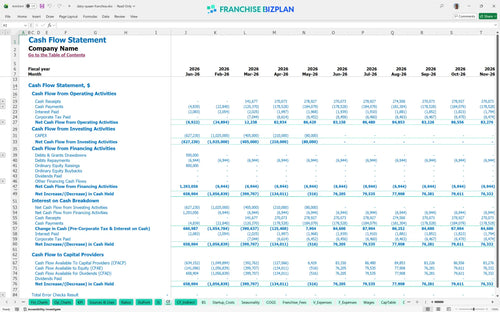
The lowest cash point hits -$932,000 in May 2026, so you need a substantial working capital reserve to survive the post-opening dip. Estimating labor and overhead for food franchises accurately is critical here, as the FTE (full-time equivalent) count grows from 18 to 28 over five years. Watch the dip before the climb.
A 'Low' scenario with a 10% revenue drop would push the payback period out significantly due to the fixed $20,000 rent. Using best practices for QSR financial forecasting, the 'High' case assumes you maximize the $580,000 hot food menu while keeping food costs at 13.2%. Plan for the best, prepare for the worst.
Finance: update unit break-even and payback model by Friday.
This franchise financial model template is built in Excel with pre-filled formulas and editable assumptions, making it easy to adapt to your specific territory or local market. You can swap out every variable from treat sales to drive-thru volume, ensuring the tool fits your exact operating scenario. Every cell is open for your input.

Planning for a single store or a small cluster requires a long-term view of cash flow and debt service. This Excel template for restaurant franchise financial projections provides a detailed 5-year outlook, starting with $2,745,000 in year-one revenue and scaling to over $4,000,000. Five years of data keeps your bank happy.

Royalties and brand funds are the 'franchise tax' that can squeeze margins if you aren't careful. This model captures specific obligations like the 4% royalty and 6% marketing fee, allowing you to see the real economics after these off-the-top costs. Royalties are the silent margin killer.

With a heavy capital expenditure budget, you need to know exactly when the doors pay for themselves. This tool functions as a franchise investment calculator to help you find the calculating break-even point for food service franchises based on your $20,000 monthly rent. Knowing your zero-point is non-negotiable.

Don't guess on your food costs or labor percentages when building your QSR franchise business plan. The model incorporates franchise unit economics like the 14% food ingredient cost and 1.8% packaging benchmark to help you sanity-check your projections. Compare your numbers to the pros.


Simply purchase and download the financial model template, then access it instantly using Microsoft Excel or Google Sheets. No installation or technical expertise required-just open and start working.

Enter your business-specific numbers, including revenue projections, costs, and investment details. The pre-built formulas will automatically calculate financial insights, saving you time and effort.

Leverage the investor-ready format to confidently showcase your financial projections to banks, franchise representatives, or investors. Impress stakeholders with clear, data-driven insights and professional reports.

Leverage the investor-ready format to confidently present your projections to banks, franchise representatives, or investors.