
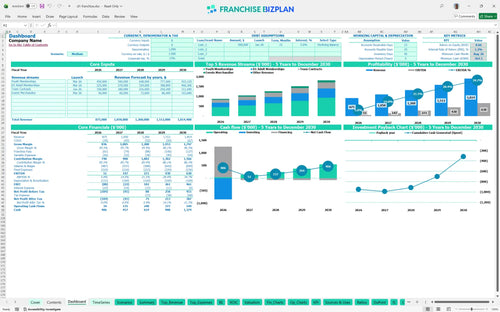
All-in-one Dashboard
Core inputs and core outputs


This template includes a full profit and loss statement, capital expenditure forecasting, and tools for estimating equipment depreciation for fitness facilities to help you evaluate the total investment required.
Core inputs and core outputs
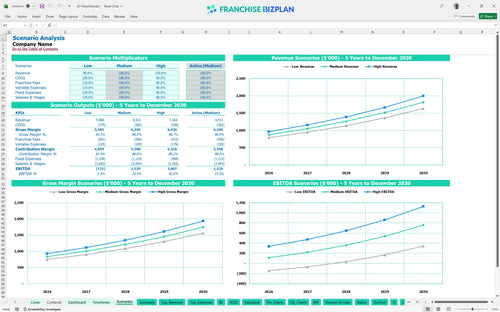
Three scenario analysis
Presentation ready
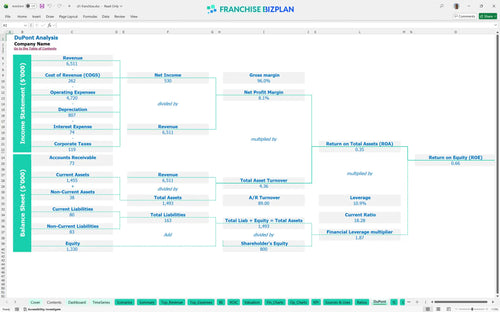
DuPont analysis
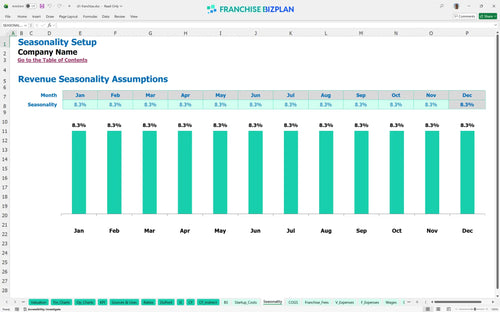
Researched revenue assumptions
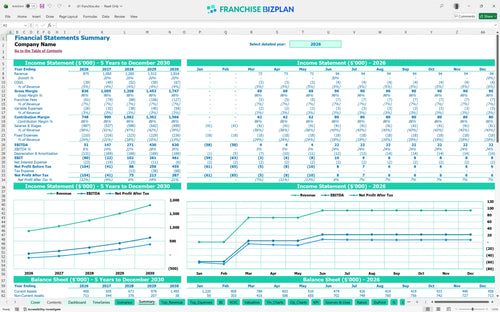
Lender-friendly financial outputs
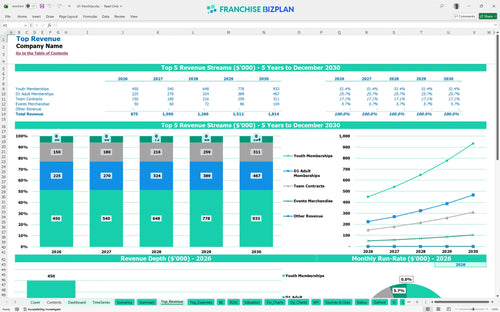
Revenue stream detailed view
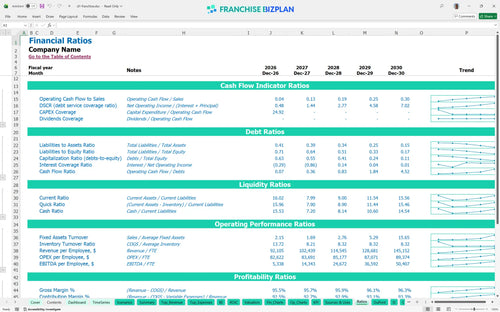
Performance metrics benchmark
We built this franchise unit financial model using our own research into the sports training sector. Key assumptions, including youth membership revenue starting at $300,000 and the $11,000 monthly rent, are pre-populated and fully editable to match your specific territory. This financial model for fitness center business plan helps you visualize how Year 1 EBITDA of $51,000 grows as you scale.
This franchise unit becomes profitable in its first year, with a projected EBITDA of $51,000. By Year 3, net profit scales to $271,000 after accounting for the 7% royalty fee and fixed costs like the $68,000 facility manager salary.
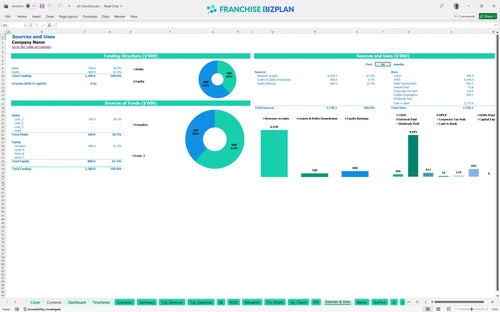
To start this franchise in the US, you need approximately $844,500 in initial capital. This covers the $59,500 franchise fee, $250,000 in leasehold improvements, and $180,000 for strength equipment, plus a cash buffer to reach the $362,000 minimum cash point. Knowing how to calculate startup costs for a sports training franchise is the first step to securing a loan.
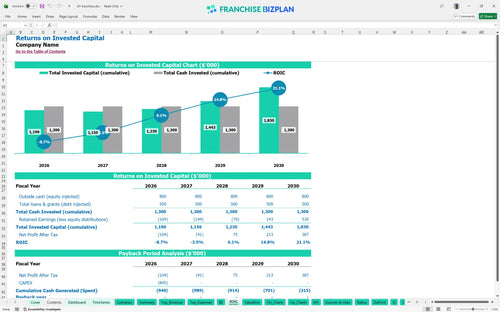
Financial planning for athletic performance centers requires looking at long-term equity. While the payback period extends beyond year 5, the model shows a 1.21% IRR and a 0.66 return on equity, reflecting the high initial capital expenditure forecasting for professional-grade facilities.
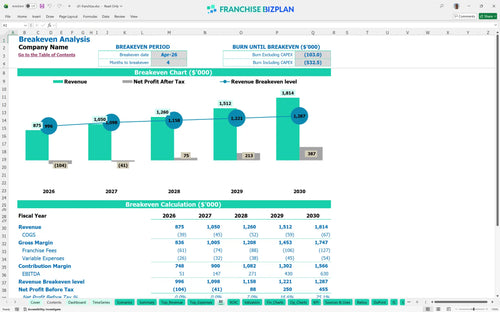
The unit reaches break-even in April 2026, just four months after opening. Revenue forecasting for youth athletic training programs is the primary lever here, as memberships must cover the $11,000 monthly rent and the $15,000+ monthly payroll for coaches and managers.
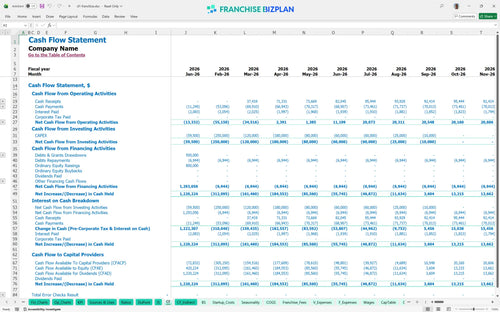
The lowest cash point hits $362,000 in August 2026, meaning you need a substantial liquidity buffer during the build-out. Calculating recurring revenue for gym memberships accurately is critical to ensuring you don't dip below your minimum cash requirements during the ramp-up phase.
The franchise financial projection spreadsheet allows for operational expense analysis across low, medium, and high scenarios. A High scenario, driven by better local marketing execution and higher member retention, can significantly pull forward the payback period and increase Year 1 margins.
Use this Excel template for franchise unit profitability to finalize your fitness franchise business plan and prepare for lender presentations. Honestly, the math only works if you stay on top of your labor and occupancy costs every single month. Finance: update unit break-even and payback model by Friday.
This franchise financial model template is built in Excel with open formulas, letting you adjust every driver from membership growth to trainer headcounts. You can swap out the pre-filled data for your specific territory to see how local rent or labor rates shift your margins.

Map out your sports training facility business model with a full profit and loss statement through 2030. The model scales revenue from $875,000 in Year 1 to over $1.8 million by Year 5, helping you track the transition from a single-unit startup to a mature performance center.

Analyzing franchise royalty and marketing fee impact is vital for store-level EBITDA. This tool calculates the 7% royalty fee automatically against your youth and adult membership revenue, ensuring you know exactly what stays in the business after the franchisor takes their cut.

Use the break-even point calculation to find the exact month your gym franchise startup costs are covered by operational cash flow. With a projected break-even in April 2026-just four months after launch-you can plan your working capital needs with precision.

This franchise unit financial feasibility study includes benchmarks for operating expenses for high-end fitness facilities. We've baked in realistic ratios for trainer wages and facility maintenance so you can defintely see if your local projections align with national standards.


Simply purchase and download the financial model template, then access it instantly using Microsoft Excel or Google Sheets. No installation or technical expertise required-just open and start working.

Enter your business-specific numbers, including revenue projections, costs, and investment details. The pre-built formulas will automatically calculate financial insights, saving you time and effort.

Leverage the investor-ready format to confidently showcase your financial projections to banks, franchise representatives, or investors. Impress stakeholders with clear, data-driven insights and professional reports.

Leverage the investor-ready format to confidently present your projections to banks, franchise representatives, or investors.