
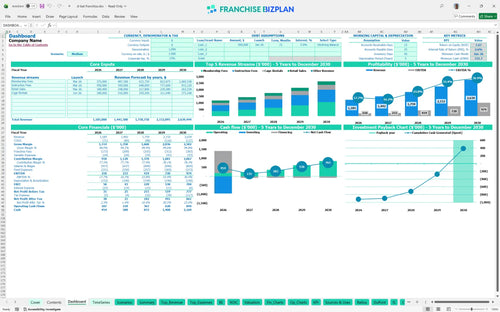
All-in-one Dashboard
Core inputs and core outputs


This franchise unit financial model template includes a complete set of tools for forecasting membership revenue, calculating ROI for youth sports coaching business units, and managing a 5-year operating budget. This is your financial flight simulator.
Core inputs and core outputs
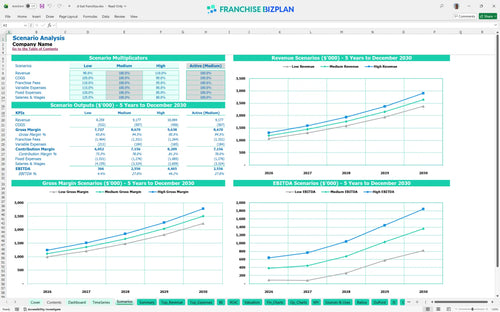
Three scenario analysis
Presentation ready
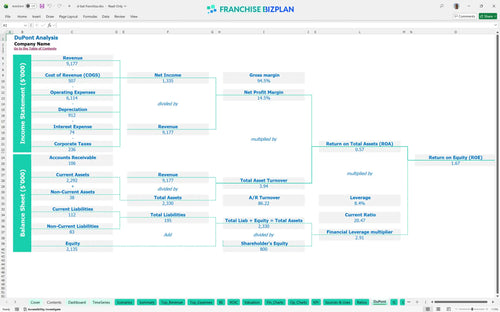
DuPont analysis
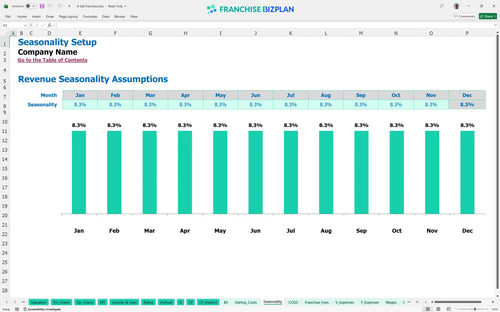
Researched revenue assumptions
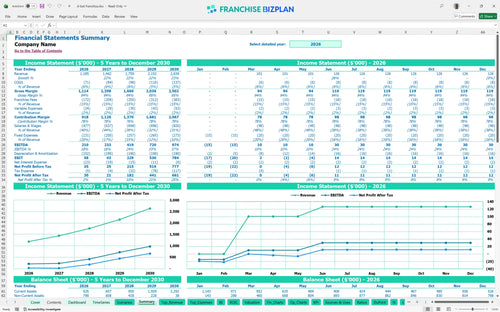
Lender-friendly financial outputs
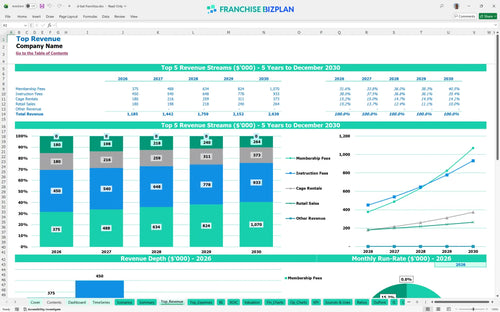
Revenue stream detailed view
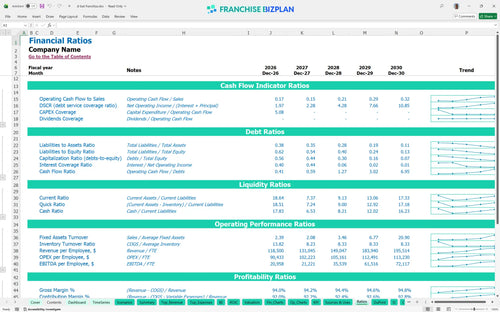
Performance metrics benchmark
We built this franchise unit financial model using our own research into high-performance athletic training centers. Key assumptions like the $45,000 franchise fee, $1.18M year-one revenue, and $210,000 EBITDA are pre-populated and fully editable to match your specific territory. Data beats guessing every single time.
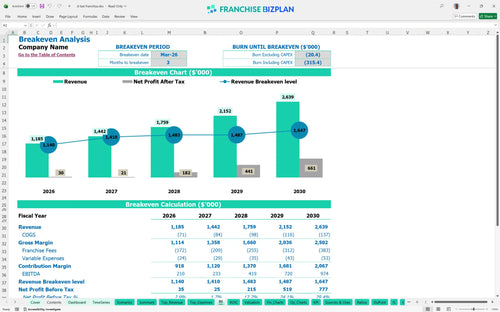
The facility reaches its break-even point in March 2026, just three months after the initial launch. By year five, the net profit trajectory accelerates significantly, with EBITDA projected to reach $974,000 as membership and instruction fees scale. Ramp-up speed dictates your survival.
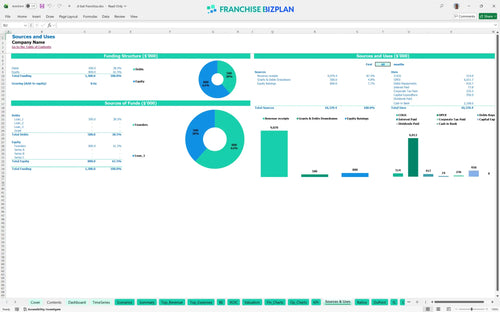
You will need approximately $950,000 to launch this facility in the US, covering the $45,000 franchise fee and heavy equipment costs. The primary uses of funds are the $350,000 leasehold build-out and the $250,000 investment in professional-grade batting cages. Build-outs always cost more than you think.
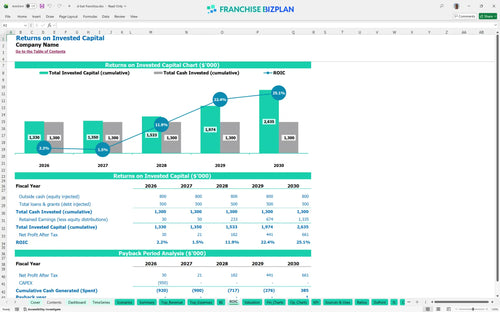
The model shows a 5-year payback period with an Internal Rate of Return (IRR) of 2.59% and a Return on Equity (ROE) of 1.67. While the initial years focus on recovering the heavy CAPEX, the year-five EBITDA of $974,000 represents a strong mature-unit margin. Patience is a requirement for this asset class.
The monthly break-even point is reached when revenue covers the $12,000 facility rent and the 14.5% total royalty and marketing burden. Membership fees are the most critical driver for reaching this point quickly, as they provide the recurring base to cover fixed overhead. Volume solves almost every problem.
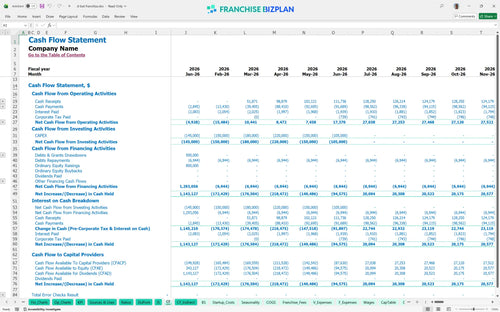
The lowest cash point occurs in June 2026, with a minimum cash balance of $332,000 remaining after the initial build-out and early operations. You should maintain a healthy buffer to manage the timing gaps between the $350,000 leasehold payments and the ramp-up of instruction fees. Watch the June 2026 dip closely.
In a high-growth scenario, hitting $2.6M in revenue by year five significantly improves your ROI and shortens the payback period. Conversely, a low-growth case where membership revenue lags can extend the payback period beyond five years and increase the peak cash need. Execution is the gap between cases.
Finance: update unit break-even and payback model by Friday
This franchise financial model template is built in Excel with fully editable assumptions, allowing you to swap out our research for your specific local data. You can adjust everything from cage rental rates to instructor hourly pay, and the pre-filled formulas will instantly update your projections. Every 1-point margin leak matters fast in a single-unit model.

We mapped out a 60-month trajectory for this sports facility business plan to show how the unit scales from launch to maturity. The model tracks how revenue grows from $1.18M in year one to $2.63M by year five, providing a clear view of long-term cash flow and balance sheet health. Mature units tell a different story than startups.

This model specifically handles the franchise royalty structure, including the 12% royalty and 2.5% marketing fund contributions required by the brand. It ensures you see the impact of these top-line expenses on your store-level margin before you ever sign a lease. Royalties are a top-line tax, not a profit share.

Use the franchise startup cost calculator to estimate your total initial investment, including the $350,000 for leasehold improvements and $250,000 for batting cages. The tool identifies your break-even point, helping you plan for the three-month ramp-up period before the facility starts covering its own costs. Cash is king, but timing is the kingdom.

We included operational overhead analysis based on industry standards for indoor athletic facilities to help you sanity-check your numbers. Whether you are looking at the $12,000 monthly rent or the 1.3% processing fees, these benchmarks help you defintely see if your local projections are realistic. Benchmarks keep your ego in check.


Simply purchase and download the financial model template, then access it instantly using Microsoft Excel or Google Sheets. No installation or technical expertise required-just open and start working.

Enter your business-specific numbers, including revenue projections, costs, and investment details. The pre-built formulas will automatically calculate financial insights, saving you time and effort.

Leverage the investor-ready format to confidently showcase your financial projections to banks, franchise representatives, or investors. Impress stakeholders with clear, data-driven insights and professional reports.

Leverage the investor-ready format to confidently present your projections to banks, franchise representatives, or investors.