


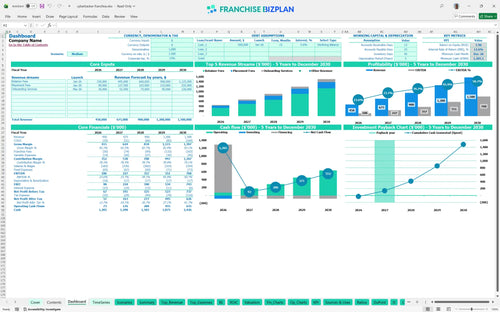
All-in-one Dashboard
Core inputs and core outputs



This comprehensive franchise business plan template includes integrated cash flow forecasting, a franchise investment feasibility study template, and automated ROI analysis for immediate business planning.
Core inputs and core outputs
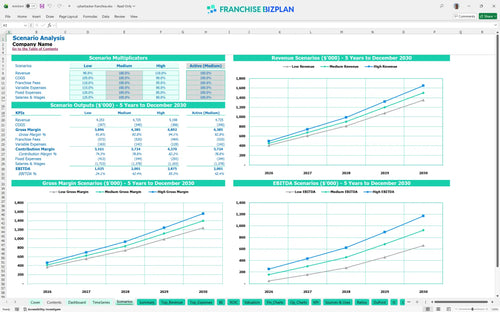
Three scenario analysis
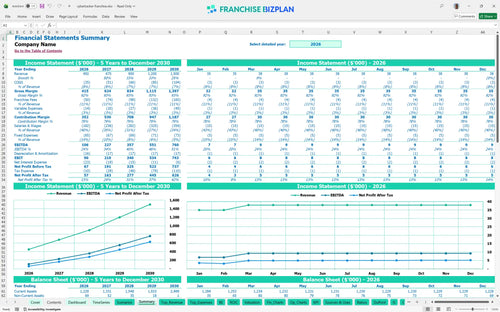
Presentation ready
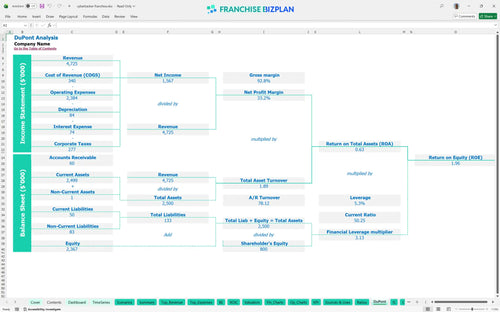
DuPont analysis
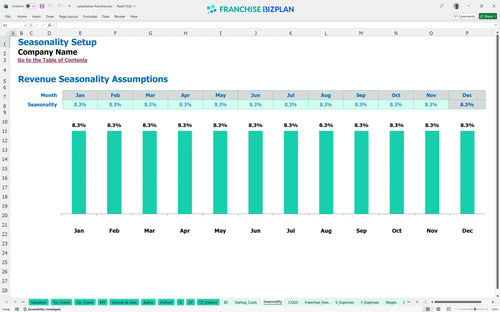
Researched revenue assumptions
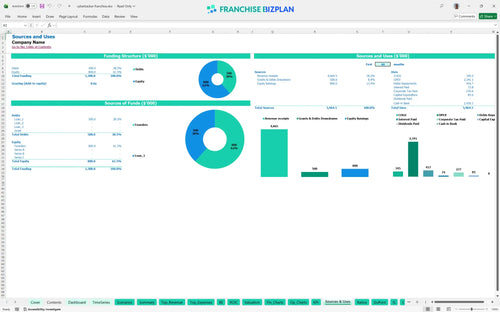
Lender-friendly financial outputs
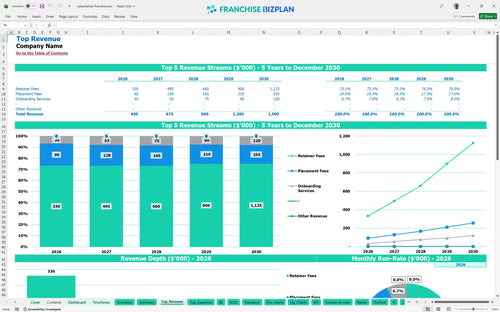
Revenue stream detailed view
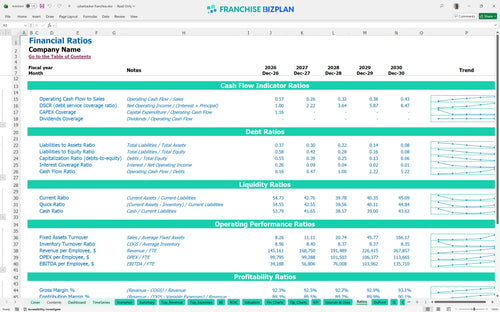
Performance metrics benchmark
We built this franchise unit financial model using our own research to provide a realistic view of the virtual staffing sector. Key assumptions, including the $220,000 Year 1 retainer fee revenue and the 11% total royalty and marketing burden, are pre-populated and fully editable. This tool helps you validate the $106,000 Year 1 EBITDA and the projected Jan-2026 breakeven date with confidence.
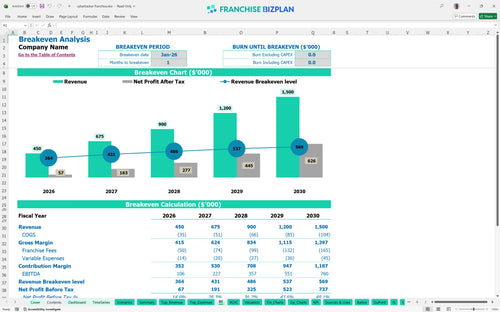
This franchise unit becomes profitable almost immediately, with a projected breakeven date of January 2026. By calculating net profit after the 8% royalty, marketing fees, and local payroll, the model shows Year 1 EBITDA reaching $106,000 and scaling to $760,000 by Year 5. Margins live and die by the success manager's ability to keep talent placed.
You need $85,000 to launch this franchise unit in the US market. This total initial investment covers the $30,000 franchise fee, $12,000 for office fit-out, and $12,500 for technology, plus an initial marketing push to build your local funnel. Cash is king, but allocation is the kingdom.
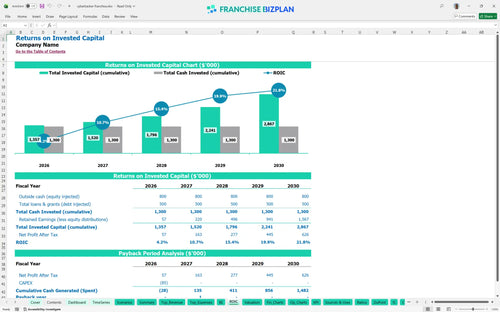
An investor can expect an Internal Rate of Return (IRR) of 12.63% and a Return on Equity (ROE) of 1.96 based on the 5-year forecast. The payback period is estimated at 2 years, which is quite strong for a service-based model with recurring revenue. A two-year payback is a green light in most service sectors.
The monthly break-even level is achieved in the first month of operation, assuming you hit your initial retainer fee targets. This is defintely faster than average because the model relies on high-margin recurring revenue and low initial fixed costs. Breakeven isn't a goal; it's a starting line.
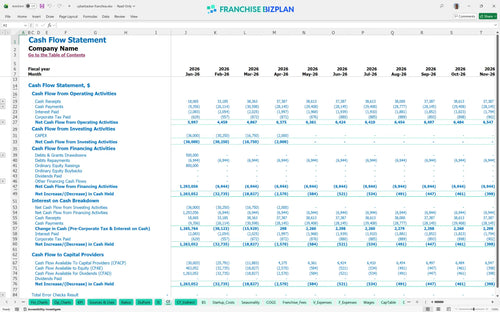
The lowest cash point is projected for December 2026 at $1,205,000, which indicates a very strong cash runway if you hit your Year 1 revenue of $450,000. Still, you should monitor your sales executive ramp-up closely to ensure cash flow stays ahead of local payroll. Liquidity is your only defense against a slow sales cycle.
The model compares Low, Medium, and High scenarios to show how a 10% shift in revenue impacts your $106,000 Year 1 EBITDA. High scenarios leverage the scalability of virtual talent, potentially driving Year 5 revenue to $1,500,000 while maintaining a lean local staff. Scenarios aren't guesses; they are your guardrails.
This franchise financial model template is a professional-grade Excel tool designed for total flexibility. You can easily adjust pre-filled formulas and editable assumptions to reflect your specific territory, whether you are managing a single unit or scaling a staffing franchise financial model. It allows you to swap out local costs and revenue targets so the projections actually match your market reality instead of a generic corporate estimate.

Planning for the long term is the only way to ensure sustainable ROI analysis. This model provides detailed 5-year franchise unit financial projections, mapping your path from a $450,000 Year 1 revenue to a $1,500,000 Year 5 target. It includes a full franchise unit profit and loss template, cash flow forecasting, and a balance sheet view to help you visualize how store-level margins evolve as you add more clients and virtual talent.

Understanding your ongoing obligations is critical for accurate franchise profitability analysis. This model specifically tracks the 8% royalty fee structure and 3% marketing fund contributions, showing exactly how these recurring costs impact your bottom line. By knowing how to forecast franchise royalty and advertising fees, you can protect your margins and ensure you are meeting all brand standards without sacrificing your take-home pay.

Launching a new territory requires a precise franchise investment breakdown to avoid early cash crunches. This franchise startup cost calculator helps you estimate the $85,000 total initial investment, including the $30,000 franchise fee and office fit-out. It simplifies the process of creating a budget for a new franchise location by identifying the exact sales volume needed to cover your $5,400 monthly fixed operating expenses.

Financial modeling for professional service franchises works best when you have a yardstick for success. This model incorporates best practices for franchise unit financial planning by including benchmarks for labor costs, such as your 6.5% virtual talent compensation, and occupancy costs like your $3,200 coworking rent. These built-in metrics allow you to sanity-check your assumptions against typical industry performance to ensure your goals are both ambitious and achievable.


Simply purchase and download the financial model template, then access it instantly using Microsoft Excel or Google Sheets. No installation or technical expertise required-just open and start working.

Enter your business-specific numbers, including revenue projections, costs, and investment details. The pre-built formulas will automatically calculate financial insights, saving you time and effort.

Leverage the investor-ready format to confidently showcase your financial projections to banks, franchise representatives, or investors. Impress stakeholders with clear, data-driven insights and professional reports.

Leverage the investor-ready format to confidently present your projections to banks, franchise representatives, or investors.