
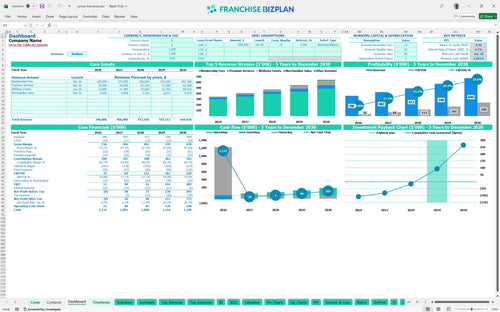
All-in-one Dashboard
Core inputs and core outputs


This comprehensive Excel tool includes everything from initial startup cost tracking to five-year profit and loss projections specifically for a boutique fitness unit.
Core inputs and core outputs
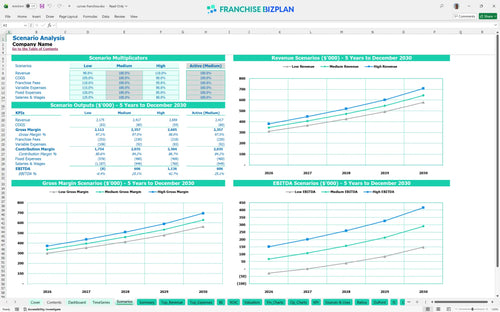
Three scenario analysis
Presentation ready
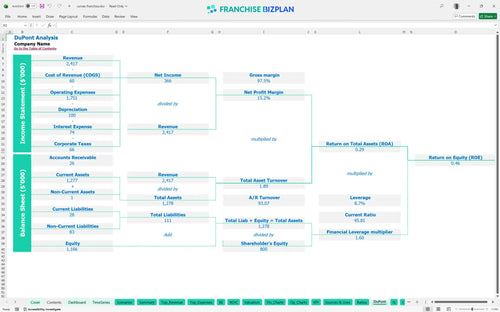
DuPont analysis
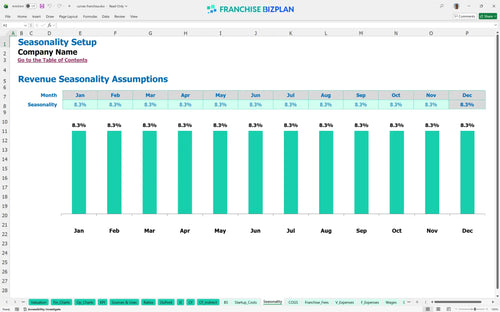
Researched revenue assumptions
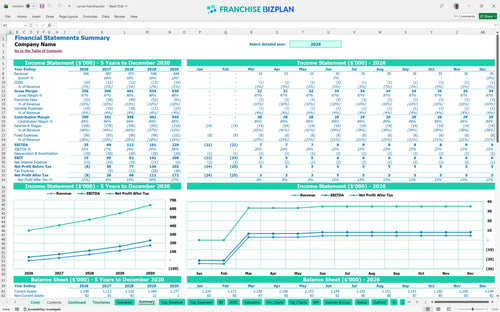
Lender-friendly financial outputs
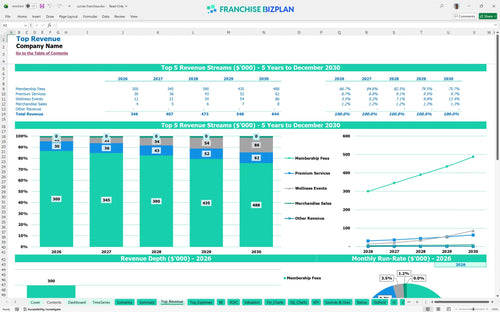
Revenue stream detailed view
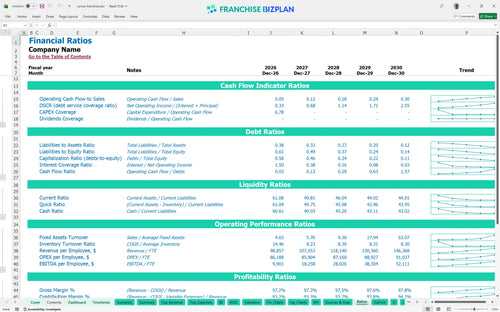
Performance metrics benchmark
We built this franchise unit financial model using our own research into boutique gym operations. Key assumptions like the $346,000 Year 1 revenue and the 7.5% royalty fee are pre-populated and fully editable to fit your specific territory. This small business franchise investment model helps you visualize how membership growth and premium services drive long-term cash flow.
The unit is projected to reach profitability quickly, with Year 1 EBITDA starting at $35,000 and climbing to $229,000 by Year 5. This fitness franchise profit and loss statement example shows that your trajectory is defintely tied to how well you upsell premium services and wellness events. Growth is slow until it isn't.
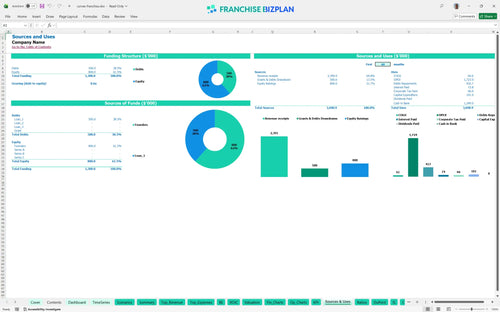
You will need approximately $101,000 to cover the initial financial requirements for opening a women's gym franchise in the US. This includes the $50,000 franchise fee, $15,000 for leasehold improvements, and $12,000 for hydraulic equipment. Cash is the oxygen of a new gym.
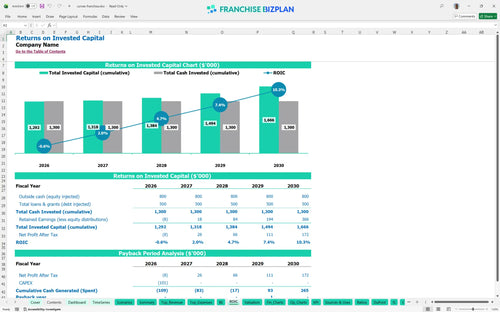
The ROI analysis indicates an Internal Rate of Return (IRR) of 4.14% and a return on equity of 0.46. You can expect a 4-year payback period as the unit matures and revenue reaches the $644,000 target. Patience is a financial requirement here.
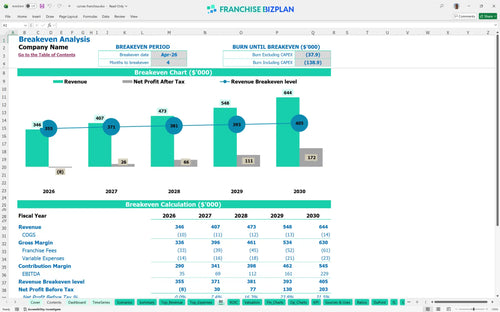
The break-even point calculation shows the unit covers all costs by April 2026, just 4 months after the March launch. This rapid timeline depends on hitting the initial $200,000 membership revenue target while managing the $5,000 monthly rent. Speed to break-even is the only metric that matters in Year 1.
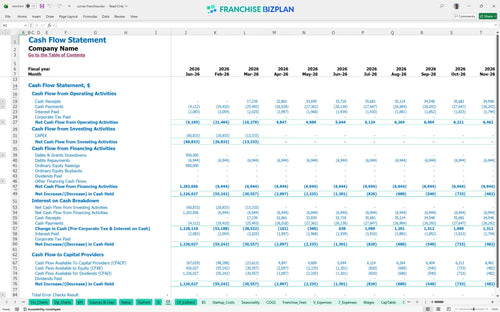
The lowest cash point hits in January 2028 at $1,094, which means you have very little room for error during the second year of operation. Knowing how to estimate monthly operating expenses for a franchise is vital to navigate this tight window safely. A thousand dollars isn't a buffer; it's a warning.
Comparing scenarios shows that reaching $644,000 in revenue by Year 5 is doable if you maximize wellness events and merchandise. Evaluating franchise investment feasibility spreadsheet data helps you see how a 1.6% digital ad spend versus a less efficient campaign changes your peak cash need. The high case is a result of daily discipline, not luck.
Finance: update unit break-even and payback model by Friday
This franchise financial model template is a flexible Excel tool that lets you swap out assumptions as fast as your market changes. You can edit everything from membership pricing to coach salaries, so you aren't stuck with a static plan. It is an Excel template for franchise financial forecasting that actually moves with your business. Flexibility is the only way to survive a five-year lease.

We've mapped out a fitness franchise business plan that looks five years into the future, covering every dollar of revenue and expense. You get a clear view of how your revenue forecasting for boutique gym franchises translates into actual bank balances. It includes a full profit and loss statement, balance sheet, and cash flow tracker. Long-term planning is just guessing unless you have the numbers to back it up.

This model handles the heavy lifting of franchise unit economics by calculating your 7.5% royalty and 2% marketing fund automatically. It tracks your initial $50,000 fee and ongoing franchise operational expenses so you see the true cost of the brand. Honestly, these fees are the price of a proven system, but they still have to be managed. Royalties are a fixed reality, not a suggestion.

Our franchise startup cost calculator breaks down the $101,000 needed to get the doors open, from signage to security systems. You will see exactly how to calculate startup costs for a fitness franchise without missing the small stuff like the $3,000 POS system. The break-even point calculation tells you exactly when the bleeding stops. Knowing your walk-in cost keeps the surprises in the gym, not the bank.

We have baked in gym franchise profitability analysis benchmarks so you can see if your $5,000 rent or $60,000 manager salary is out of line. These fitness center franchise financial planning tools help you sanity-check your margins against industry standards. It is about making sure your labor and occupancy costs do not eat your lunch. Benchmarks are the guardrails that keep your investment on the road.


Simply purchase and download the financial model template, then access it instantly using Microsoft Excel or Google Sheets. No installation or technical expertise required-just open and start working.

Enter your business-specific numbers, including revenue projections, costs, and investment details. The pre-built formulas will automatically calculate financial insights, saving you time and effort.

Leverage the investor-ready format to confidently showcase your financial projections to banks, franchise representatives, or investors. Impress stakeholders with clear, data-driven insights and professional reports.

Leverage the investor-ready format to confidently present your projections to banks, franchise representatives, or investors.