


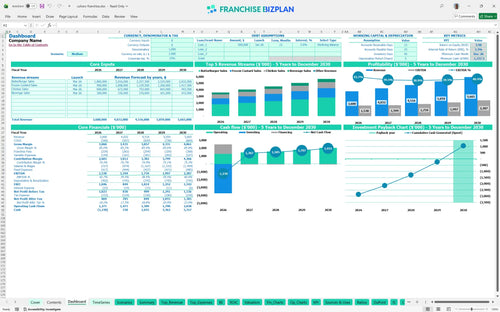
All-in-one Dashboard
Core inputs and core outputs



This franchise unit economics template provides a complete Excel-based toolkit for forecasting revenue, managing CAPEX, and analyzing multi-year profitability for a high-volume restaurant unit.
Core inputs and core outputs
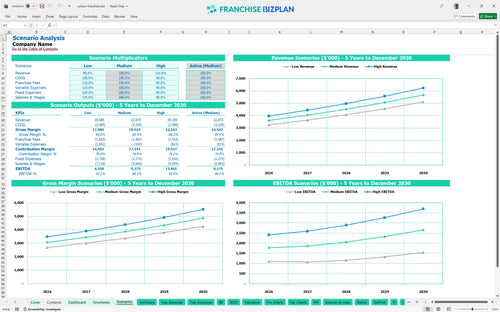
Three scenario analysis
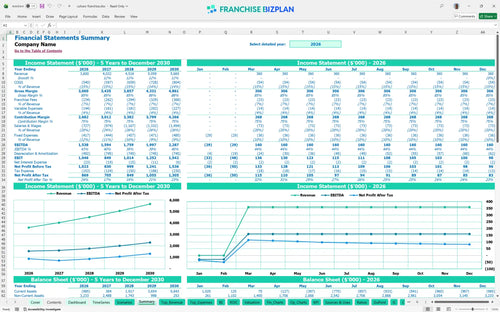
Presentation ready
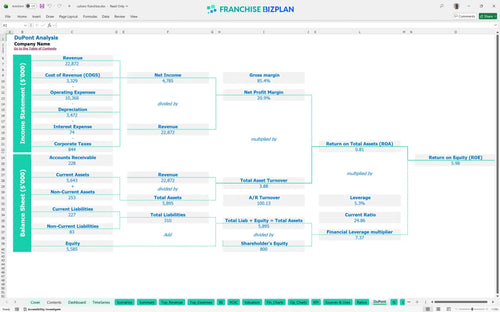
DuPont analysis
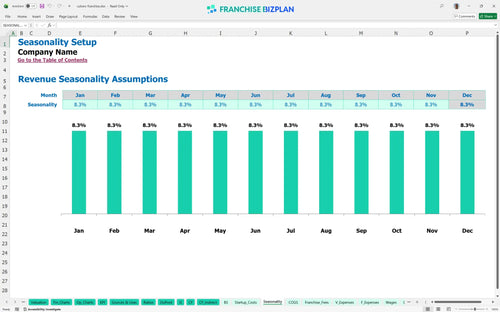
Researched revenue assumptions
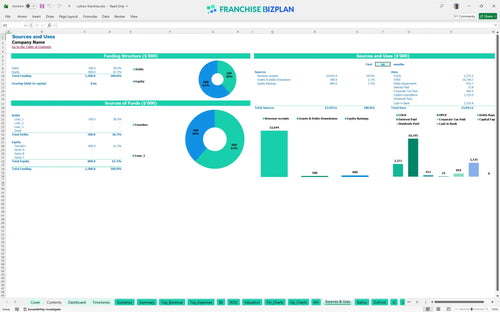
Lender-friendly financial outputs
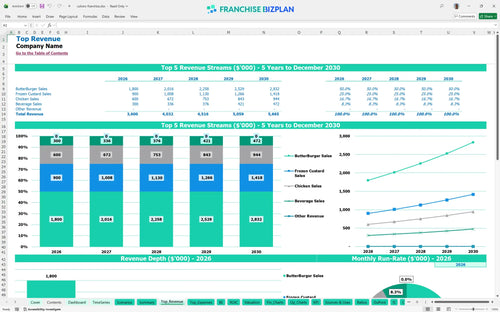
Revenue stream detailed view
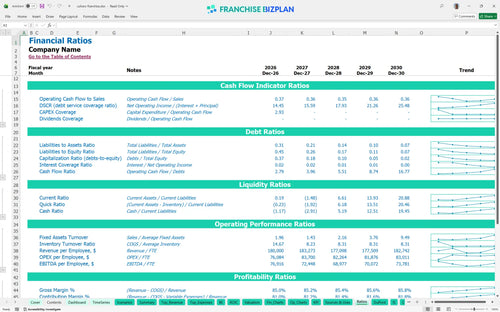
Performance metrics benchmark
We built this franchise unit financial model based on deep research into high-volume burger and custard concepts. The pre-populated data covers everything from $3.6 million in year-one revenue to specific staffing needs for a dual-lane drive-thru, and every number is fully editable to match your local market reality. Honestly, seeing the $1.5 million year-one EBITDA helps you understand the scale of this operation, but the $3.7 million entry price means you need to be precise with your execution.
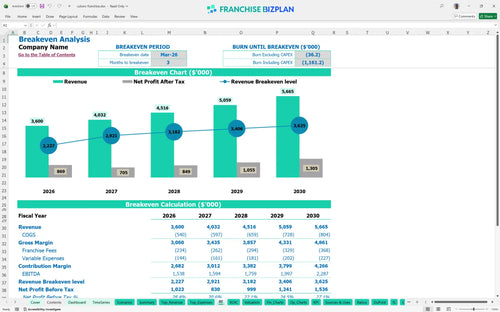
The unit hits operational profitability almost immediately, with a break-even date in March 2026, just three months after launch. With year-one EBITDA projected at $1,538,000, the model shows strong early performance despite the 4% royalty and 2.5% marketing fees. This assumes you hit the ground running with $1.2 million in annual burger sales and $600,000 in custard sales right out of the gate.
You will need approximately $3.73 million to get this unit off the ground in the US market. This covers everything from the $55,000 franchise fee to the massive $1.8 million leasehold improvement budget required for a high-spec building. The model also accounts for $650,000 in kitchen equipment and a $450,000 investment in drive-thru infrastructure to handle high-volume traffic.
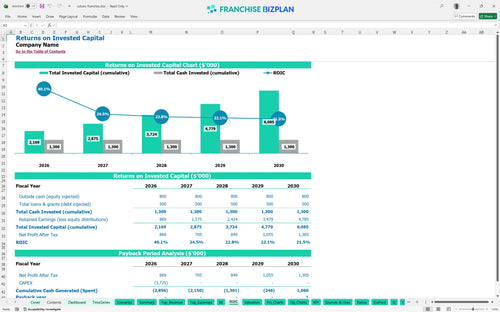
The model projects a 5-year payback period with an Internal Rate of Return (IRR) of 3.32% and a Return on Equity (ROE) of 5.98%. While the IRR might look modest, it reflects the heavy upfront capital expenditure analysis of nearly $4 million. Still, the steady climb in EBITDA-reaching $2.28 million by year five-shows the long-term wealth-building potential of the asset once the initial debt is serviced.
Monthly break-even is achieved in the third month of operation, provided you maintain a steady flow of traffic across all four revenue streams. The biggest driver here is volume; with $25,000 in monthly rent and a $95,000 GM salary, you need the high throughput of the dual-lane drive-thru to cover fixed costs. If your average ticket drops, you will defintely need to tighten the labor schedule fast to stay in the black.
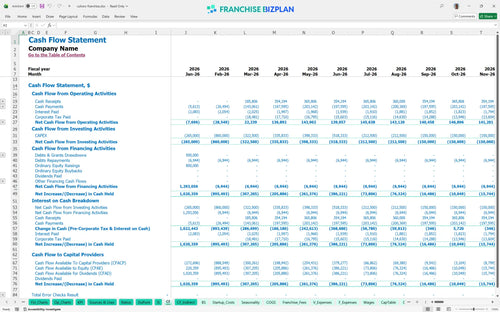
The lowest cash point occurs in December 2026, with a projected minimum cash need of $1.238 million during the initial ramp and construction phase. You need to ensure your financing is robust enough to cover this gap before the high-volume sales fully kick in. We recommend a 15% cash buffer above the projected minimum to handle any construction delays or slower-than-expected winter sales.
A 10% drop in revenue in a 'Low' scenario significantly delays your payback period and could push the minimum cash requirement deeper into the red. Conversely, hitting the 'High' case by maximizing beverage and custard sales-which have lower COGS than burgers-can accelerate your ROI by a full year. The model allows you to toggle these variables to see how a 1-point shift in labor or food costs changes your year-1 margin.
Finance: update unit break-even and payback model by Friday.
This franchise financial model lives in Excel, giving you total control over the numbers that drive your investment. You can adjust pre-filled formulas and editable assumptions to match your specific territory, whether you are looking at a high-traffic corner or a suburban plot. It is built to handle complex scenarios, so you can test how changes in labor or food costs impact your bottom line before you sign a lease.

Planning for restaurant franchise startup costs requires more than just a first-year view; you need a long-term map of your cash flow. This tool provides 5-year revenue, cost, and profit projections tailored for a high-volume quick-service unit. By mapping out five years, you can see how annual revenue growth-projected to climb from $3.6 million to over $5.6 million-actually translates into distributable cash after debt service and taxes.

The model simplifies franchise royalty fee calculation by automating the 4% royalty and 2.5% marketing fund deductions from your gross sales. It tracks the initial $55,000 franchise fee alongside these ongoing obligations to show you the real economics of operating the unit. Understanding these 'off-the-top' costs is vital because they eat into your store-level margin regardless of your labor or rent efficiency.

Estimating the total capital needed for a financial modeling for multi-lane drive thru restaurant requires a granular look at leaseholds and equipment. This break even analysis template for franchise business helps you visualize the $1.8 million in leasehold improvements and $650,000 in kitchen gear required to open. It calculates the exact sales volume you need to hit each month to cover your $25,000 rent and other fixed overheads.

We include benchmarks for fast casual franchise profitability analysis so you can compare your projections against industry standards. If your food ingredients are hitting 13% of sales, the model helps you see if that is lean or bloated compared to typical high-volume burger concepts. These sanity checks are essential for a financial feasibility study for new franchise location, ensuring your labor and occupancy costs stay within a healthy range.


Simply purchase and download the financial model template, then access it instantly using Microsoft Excel or Google Sheets. No installation or technical expertise required-just open and start working.

Enter your business-specific numbers, including revenue projections, costs, and investment details. The pre-built formulas will automatically calculate financial insights, saving you time and effort.

Leverage the investor-ready format to confidently showcase your financial projections to banks, franchise representatives, or investors. Impress stakeholders with clear, data-driven insights and professional reports.

Leverage the investor-ready format to confidently present your projections to banks, franchise representatives, or investors.