
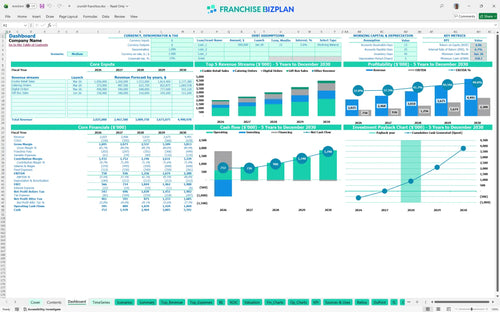
All-in-one Dashboard
Core inputs and core outputs


This cookie shop financial projection spreadsheet provides a complete roadmap for managing unit-level cash flow, investment returns, and daily operational performance metrics.
Core inputs and core outputs
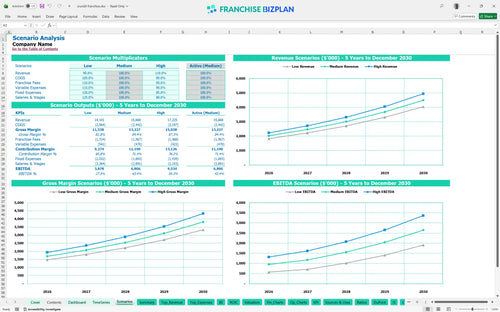
Three scenario analysis
Presentation ready
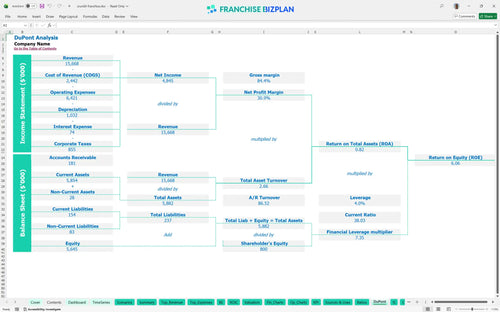
DuPont analysis
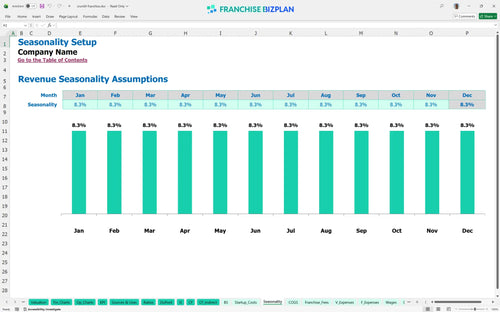
Researched revenue assumptions
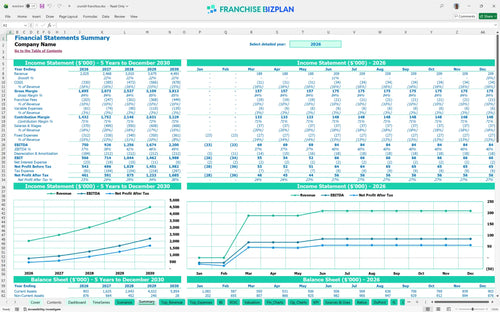
Lender-friendly financial outputs
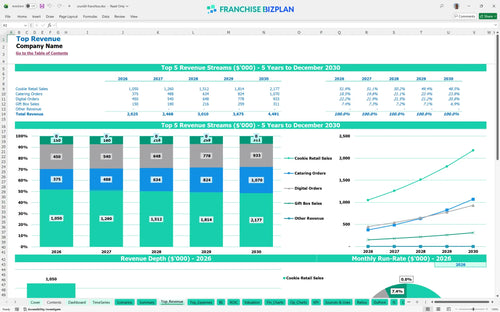
Revenue stream detailed view
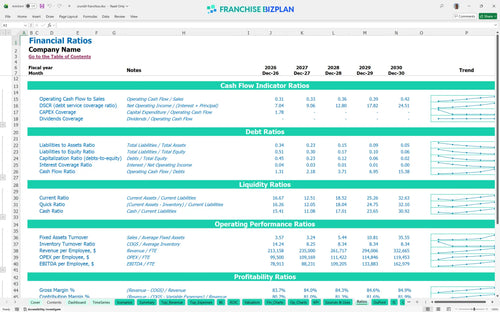
Performance metrics benchmark
We built this franchise unit financial model using our own research to reflect the high-volume nature of a premium dessert shop. Key assumptions like the $2,025,000 year-one revenue and 8% royalty fees are pre-populated and fully editable to match your specific site. It is a practical tool for anyone looking to estimate dessert franchise profitability without the guesswork.
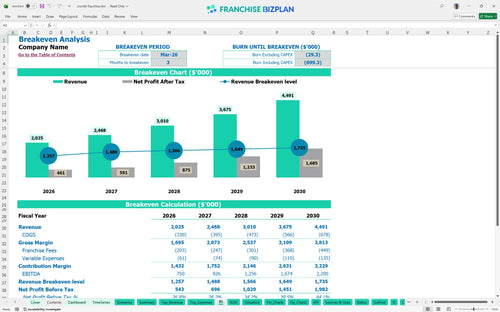
Based on the data, this unit hits its stride quickly, reaching breakeven by March 2026. With EBITDA climbing from $750,000 in year one to $2,200,000 by year five, the trajectory is aggressive but defintely depends on maintaining those 14% ingredient margins.
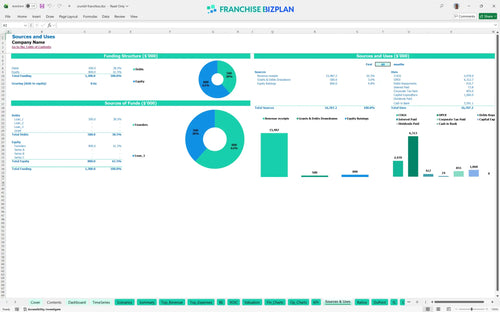
Launching this unit requires a total initial investment of roughly $1,060,000 to cover the $50,000 franchise fee and heavy build-out costs. You will need to account for $450,000 in leasehold improvements and $250,000 for high-end bakery equipment before the first cookie is sold.
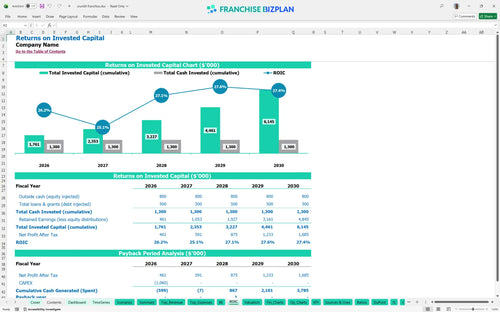
This franchise investment analysis shows an IRR of 6.67% and a Return on Equity of 6.06%. The payback period is 3 years, which is standard for a restaurant franchise financial model excel that requires significant upfront CAPEX for a flagship location.
The unit reaches its break-even date in March 2026, just 3 months after the planned launch. The biggest driver for this is the $20,000 monthly rent; you need high throughput from retail and digital orders to cover that fixed occupancy cost quickly.
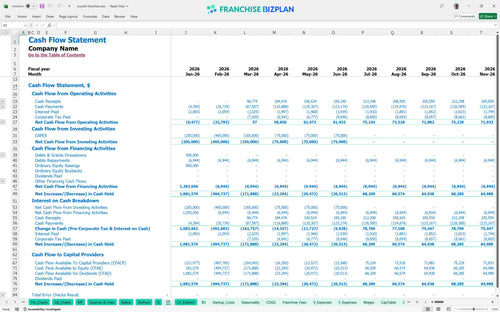
Your minimum cash position is projected at $351,000 in June 2026. This is the critical window where ramp-up costs meet ongoing operational expenses, so having that buffer is vital to survive the first six months of trading.
Moving from a medium to a high-growth scenario shifts your year-five revenue from $4,491,000 upward, significantly boosting the franchise cash flow model. Retail franchise financial forecasting tools show that even a small shift in COGS or labor can drastically change your peak cash need during the 2026 ramp-up.
Finance: update unit break-even and payback model by Friday.
This franchise financial model lives in Excel, giving you total control over the numbers. You can swap out the pre-filled assumptions for your specific territory or lease terms without breaking the math. It is built to handle everything from local labor rates to specific delivery commission percentages so your plan stays realistic.

Mapping out a long-term vision requires more than just a first-year guess. This tool provides a 5-year revenue and profit outlook, showing how scaling from $2.02M to $4.49M in annual sales impacts your bottom line. It tracks cash flow and balance sheet health to ensure you are not just growing sales, but building actual equity.

Franchise obligations can eat margin if you do not track them precisely. The model bakes in the 8% royalty and 2% marketing fund fees directly against your gross sales. By automating these calculations, you see the true net impact on your cookie shop profitability before you ever sign the legal paperwork.

Knowing how to calculate startup costs for a bakery franchise is the first step to avoiding a cash crunch. We have detailed over $1M in initial outlays, from leasehold improvements to specialized ovens. The model then identifies exactly when your monthly volume covers these fixed costs, giving you a clear target for your grand opening.

You should not fly blind when it comes to operating expenses. This franchise unit business plan template for retail includes researched benchmarks for labor and rent to help you spot red flags. If your projected ingredient costs or staffing levels drift too far from the 14% COGS or $20,000 monthly rent norms, you will know exactly where to tighten up.


Simply purchase and download the financial model template, then access it instantly using Microsoft Excel or Google Sheets. No installation or technical expertise required-just open and start working.

Enter your business-specific numbers, including revenue projections, costs, and investment details. The pre-built formulas will automatically calculate financial insights, saving you time and effort.

Leverage the investor-ready format to confidently showcase your financial projections to banks, franchise representatives, or investors. Impress stakeholders with clear, data-driven insights and professional reports.

Leverage the investor-ready format to confidently present your projections to banks, franchise representatives, or investors.