
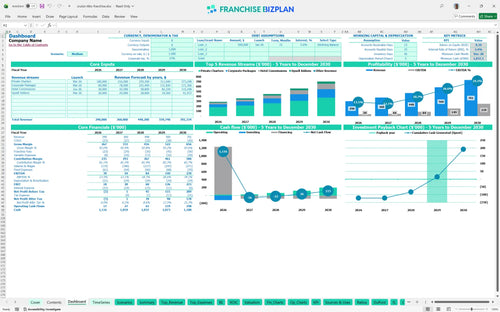
All-in-one Dashboard
Core inputs and core outputs


This franchise investment analysis tool provides a complete 60-month outlook covering startup costs, seasonal revenue streams, and detailed payroll for captains and crew.
Core inputs and core outputs
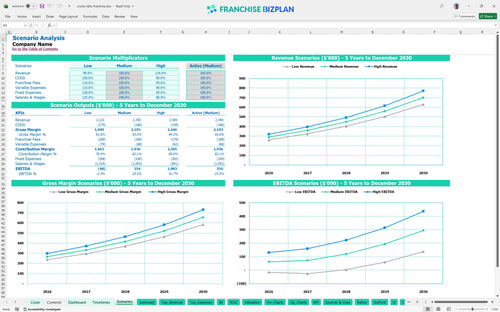
Three scenario analysis
Presentation ready
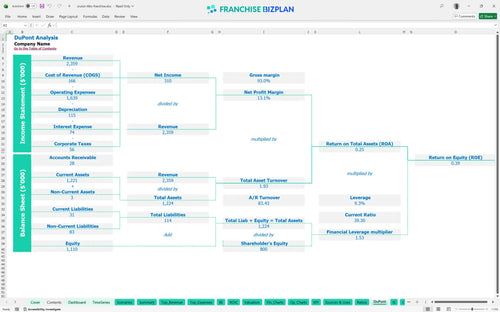
DuPont analysis
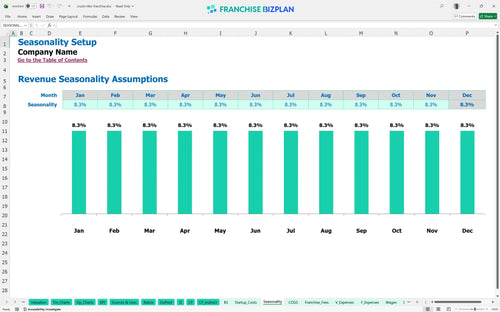
Researched revenue assumptions
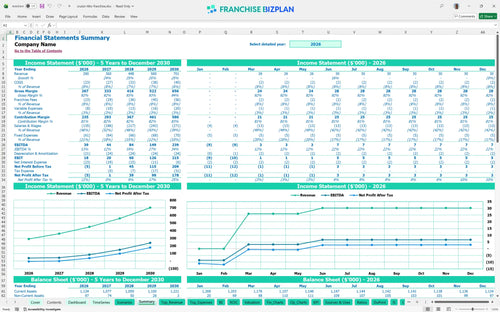
Lender-friendly financial outputs
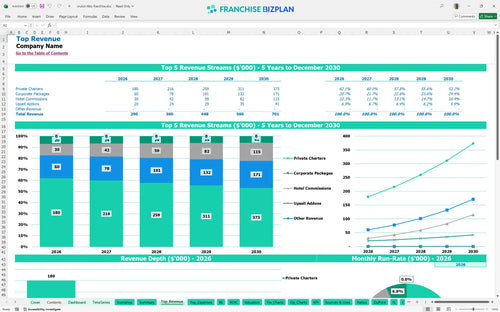
Revenue stream detailed view
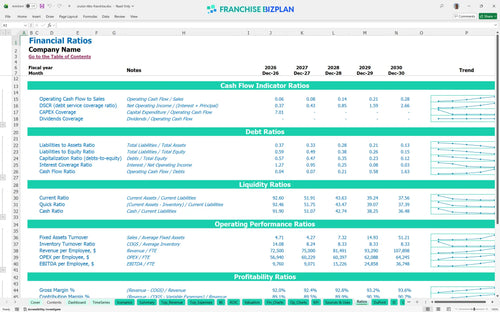
Performance metrics benchmark
We developed this financial model for recreational boat rental franchise units using detailed research into mobile vessel operations and marina-based overhead. The pre-populated data includes four distinct revenue streams and specific CAPEX requirements, like the $50,000 primary tiki hut, to give you a head start on your franchise investment feasibility study template. With a projected year-five EBITDA of $239,000, this model helps you visualize the full earning potential of a well-run territory.
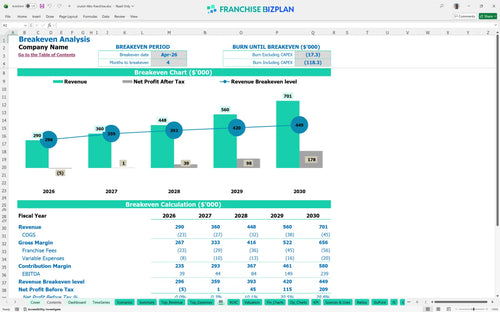
This unit is projected to reach its break-even point in April 2026, just four months after the initial launch. By year three, the model shows an EBITDA of $84,000 after accounting for all royalties, fuel costs, and the $40,000 operations manager salary.
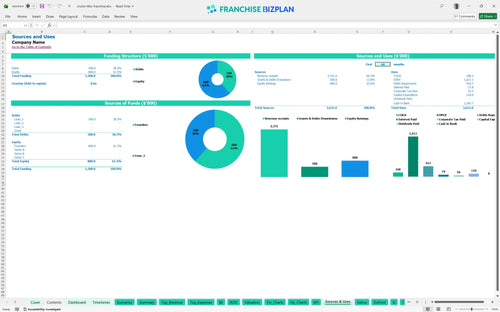
You will need $118,000 in total capital to cover the initial franchise fee and the acquisition of your primary and secondary vessels. This includes $20,000 for the brand rights and $75,000 for the tiki huts, plus additional funds for navigation and safety gear.
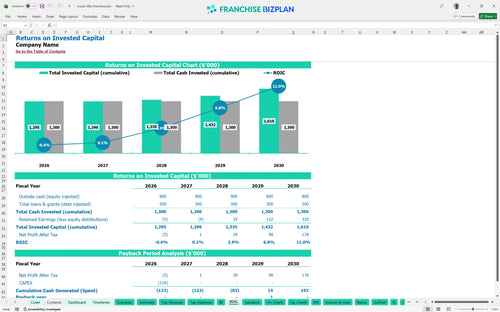
Investors can expect a 4-year payback period and an Internal Rate of Return (IRR) of 3.35% based on the current growth trajectory. The model also shows a Return on Equity (ROE) of 0.39, reflecting the steady ramp-up of private charter and corporate package revenue.
The monthly break-even point occurs in April 2026, driven primarily by the volume of private charters which start at $120,000 in year one. Managing your $40,000 fixed captain salaries against seasonal weather patterns is the biggest factor in hitting this milestone on time.
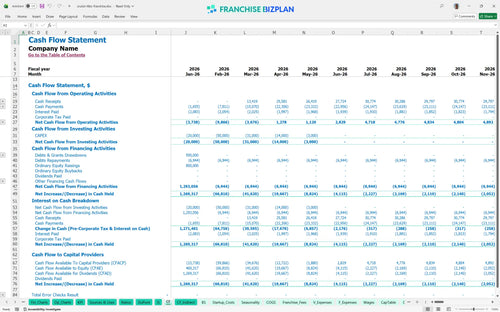
The lowest cash point occurs in December 2028 with a balance of $1,037,000, assuming you follow the planned expansion and vessel purchases. Maintaining a cash buffer is defintely recommended to handle the off-season months when marina slip fees and insurance stay fixed while bookings dip.
A high-growth scenario pulls the 4-year payback forward by increasing the throughput of corporate packages and hotel commissions. If year-one revenue exceeds the $290,000 target, your store-level margin improves significantly, allowing for faster reinvestment into additional vessels.
Finance: update unit break-even and payback model by Friday.
This franchise financial model template is a fully editable Excel tool designed to handle the specific variables of a water-based entertainment business. You can adjust everything from seasonal charter rates to fuel costs, making it easy to see how local market shifts impact your bottom line.

Long-term planning is essential when managing a fleet of vessels, and this model provides a clear 5-year roadmap for revenue and cash flow. It tracks your growth from an initial $290,000 in year-one sales to a projected $701,000 by year five, allowing for precise capital expenditure planning as you scale.

Understanding your ongoing obligations to the franchisor is critical for maintaining healthy store-level margins. This Excel template for franchise royalty and fee tracking automatically calculates the 6% royalty and 2% marketing fund contributions against your projected charter revenue so there are no surprises.

Estimating small business franchise startup costs requires looking at both the $20,000 initial fee and the $98,000 needed for vessels and equipment. This model identifies your break-even sales level, helping you understand exactly how many private charters you need to book to cover your $2,000 monthly marina slip fees.

We have integrated real-world unit economics for mobile boat businesses, including USCG-licensed captain wages and vessel insurance costs. These benchmarks allow you to sanity-check your operational expense forecasting against typical industry ranges to ensure your pro-forma is realistic.


Simply purchase and download the financial model template, then access it instantly using Microsoft Excel or Google Sheets. No installation or technical expertise required-just open and start working.

Enter your business-specific numbers, including revenue projections, costs, and investment details. The pre-built formulas will automatically calculate financial insights, saving you time and effort.

Leverage the investor-ready format to confidently showcase your financial projections to banks, franchise representatives, or investors. Impress stakeholders with clear, data-driven insights and professional reports.

Leverage the investor-ready format to confidently present your projections to banks, franchise representatives, or investors.