
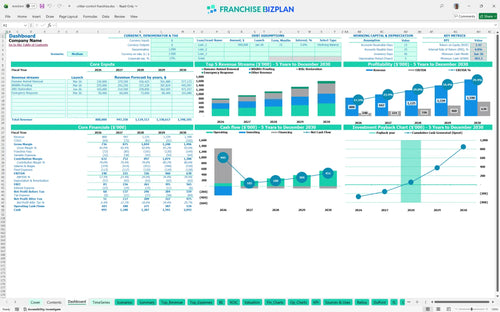
All-in-one Dashboard
Core inputs and core outputs


This Excel model for estimating franchise unit profitability includes detailed revenue streams, comprehensive capital expenditure schedules, and multi-scenario analysis for a wildlife removal operation.
Core inputs and core outputs
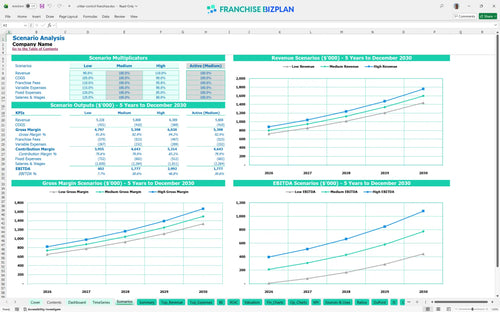
Three scenario analysis
Presentation ready
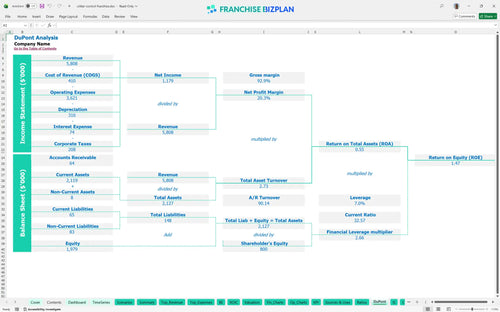
DuPont analysis
Researched revenue assumptions
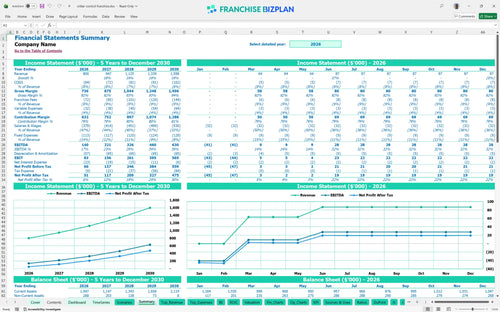
Lender-friendly financial outputs
Revenue stream detailed view
Performance metrics benchmark
We developed this franchise unit profitability analysis using deep-dive research into the wildlife management sector. The pre-populated data covers everything from $18,000 thermal imaging equipment to $5,500 monthly facility rent, allowing you to project a 3-year payback period with confidence. Key assumptions like the 7% royalty and 2% marketing fee are already baked into the Year 1 $800,000 revenue target.
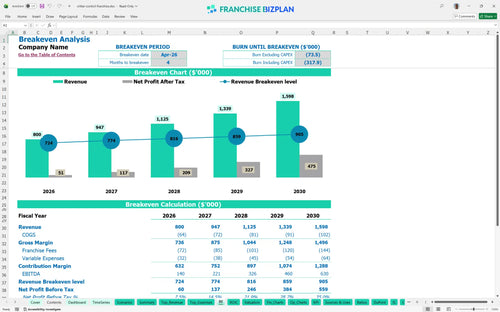
You can expect to hit the break-even point by April 2026, just four months after launch. Net profit scales defintely fast as you move from a $140,000 EBITDA in Year 1 to $630,000 by Year 5, provided you maintain the 7% royalty and 2% marketing fee structure.
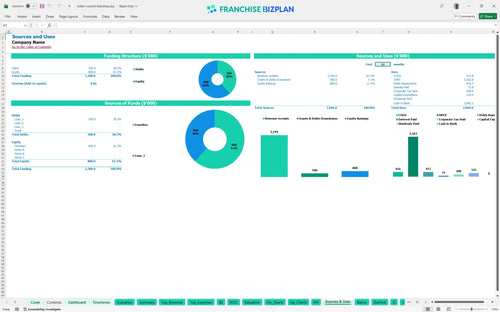
Launching this unit requires a significant upfront investment, primarily driven by the $111,900 franchise fee and $80,000 for service vehicles. Your total initial capital must also cover a minimum cash need of $903,000 to handle the ramp-up phase through June 2026.
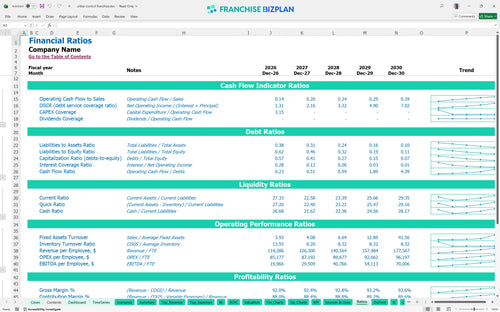
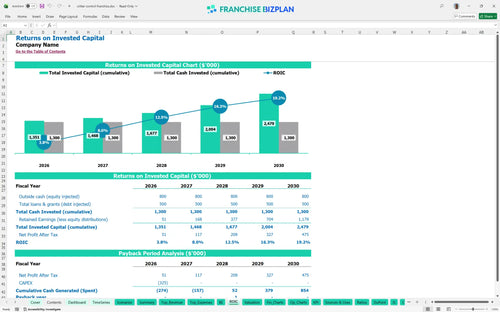
Estimating ROI for a new residential service franchise shows a 3-year payback period and an Internal Rate of Return (IRR) of 4.84%. While the ROE stands at 1.47, the real value lies in the cash flow growth, with EBITDA more than quadrupling between Year 1 and Year 5.
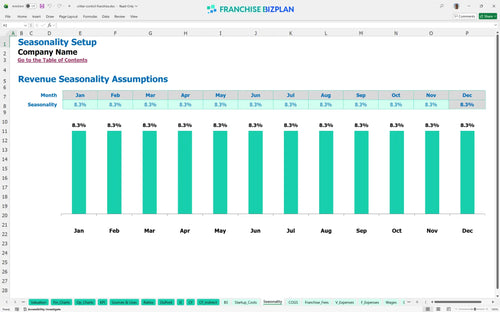
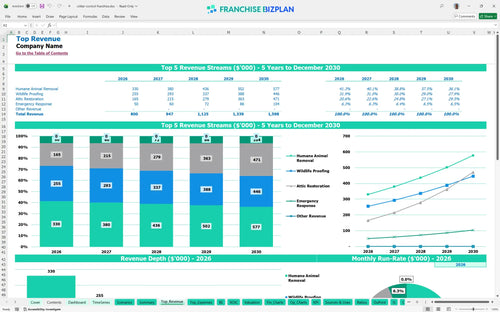
Your monthly break-even depends on covering $9,250 in fixed costs, including rent, utilities, and insurance. The primary driver is service volume in the Humane Animal Removal segment, which is projected to generate $220,000 in its first full year.
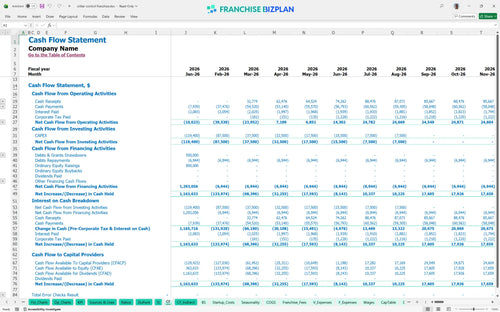
The lowest cash point occurs in June 2026 at $903,000, suggesting you need a substantial liquidity buffer during the first six months of operations. Projecting revenue and expenses for a pest control business unit shows that while you break even early, the heavy initial CAPEX drains cash quickly.
Financial forecasting tools for new franchise owners show that a 10% drop in revenue can delay payback by over a year. Conversely, hitting the High case through aggressive local marketing execution can push Year 1 margins higher and reduce the peak cash need before the June 2026 low point.
Finance: update unit break-even and payback model by Friday.
This franchise unit financial model template is a fully editable Excel tool designed for precision. You can swap out the pre-filled wildlife removal assumptions for your specific territory data, making it easy to stress-test your pest control franchise business plan before signing a lease or committing capital.

Map out your wildlife removal franchise startup costs and revenue trajectory over a 60-month horizon. With Year 1 sales starting at $800,000 and scaling to nearly $1.6M by Year 5, this franchise financial projection template helps you visualize the transition from a single-truck operation to a dominant local fleet.

Managing a 7% royalty and a 2% marketing fund is non-negotiable for brand standards. This model automates these franchise royalties calculations against your gross sales, ensuring you see the exact impact on your store-level margin after the initial $111,900 franchise fee is paid.

Evaluating startup capital for an animal control franchise requires looking past the initial fee to the $324,900 in total capital expenditure. This tool identifies your break-even date-estimated here at April 2026-by weighing fixed costs like $5,500 monthly rent against your service volume and average ticket.

Use this financial planning guide for service-based franchises to compare your labor costs against industry norms. With a Year 1 EBITDA of $140,000, you can verify if your staffing model-including an Operations Manager and three technicians-aligns with the efficiency required for high-margin wildlife exclusion business financial planning.


Simply purchase and download the financial model template, then access it instantly using Microsoft Excel or Google Sheets. No installation or technical expertise required-just open and start working.

Enter your business-specific numbers, including revenue projections, costs, and investment details. The pre-built formulas will automatically calculate financial insights, saving you time and effort.

Leverage the investor-ready format to confidently showcase your financial projections to banks, franchise representatives, or investors. Impress stakeholders with clear, data-driven insights and professional reports.

Leverage the investor-ready format to confidently present your projections to banks, franchise representatives, or investors.