
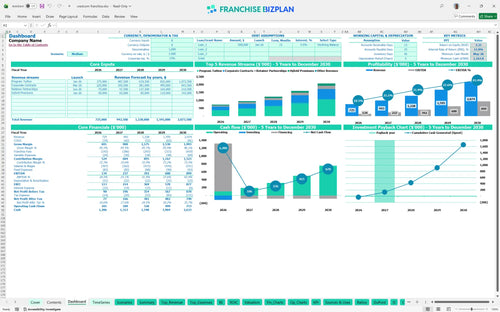
All-in-one Dashboard
Core inputs and core outputs


This comprehensive tool includes a franchise business plan template, dynamic P&L statements, and cash flow tools designed specifically for the executive training sector.
Core inputs and core outputs
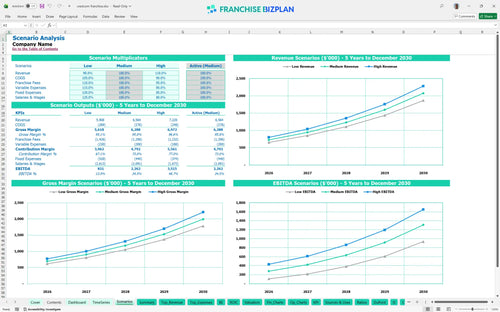
Three scenario analysis
Presentation ready
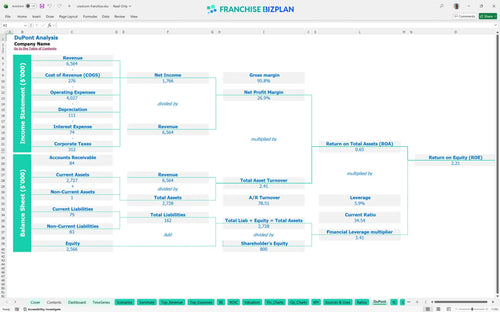
DuPont analysis
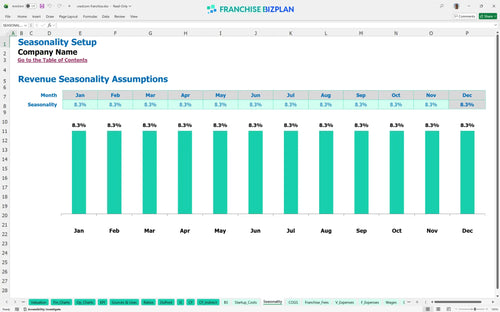
Researched revenue assumptions

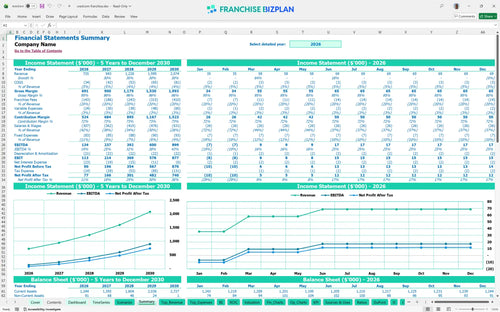
Lender-friendly financial outputs
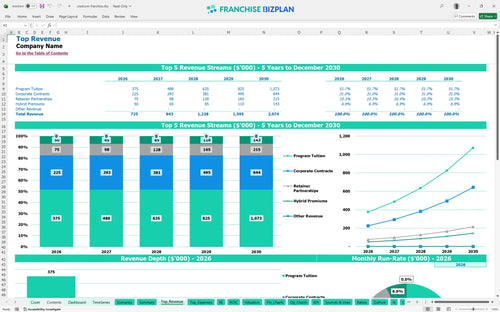
Revenue stream detailed view
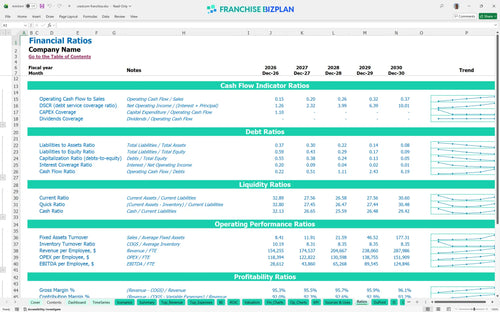
Performance metrics benchmark
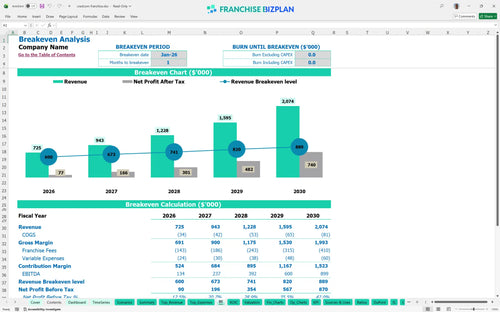
We built this leadership training franchise business plan model using deep research into the executive coaching sector. Key assumptions, including the $75,000 franchise fee and the 19.75% royalty structure, are pre-populated and fully editable to match your specific territory. With year-one revenue projected at $725,000 and a 2-year payback period, this model provides a credible roadmap for scaling a professional services unit.
The model shows a very fast ramp-up, reaching a break-even point in January 2026, just one month after launch. With year-one EBITDA projected at $134,000, the unit moves quickly into the black because the service-based nature of the business keeps COGS (cost of goods sold) low, around 4.7% for materials and printing. Speed to profit is the ultimate safety net.
You need approximately $111,919 in initial capital to cover the primary startup costs for this US-based unit. This includes the $75,000 franchise fee and $36,919 for the physical hub, equipment, and branding. While the model shows a high minimum cash balance of $1,163,000 by May 2026, this likely reflects a significant working capital reserve or financing buffer to support rapid scaling. Capital is fuel for your sales engine.
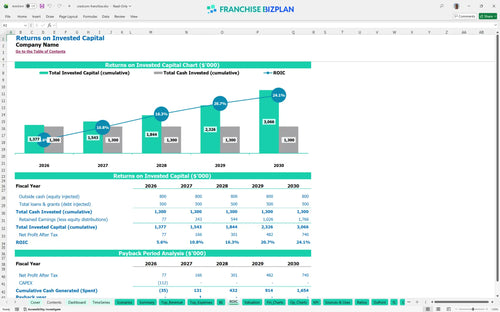
Investors can expect an Internal Rate of Return (IRR) of 11.01% and a Return on Equity (ROE) of 2.21. The payback period is remarkably short at just 2 years, meaning you recoup your initial investment quickly compared to traditional brick-and-mortar retail. By year five, the $899,000 EBITDA represents a significant multiple of the initial startup costs. Efficiency drives these executive-level returns.
The unit hits its break-even point in month one, requiring roughly $60,000 in monthly revenue to cover the $4,200 rent, $17,500 salary load, and the 19.75% royalty burden. The primary driver for reaching this point is the volume of program tuitions, which account for the largest share of the $725,000 year-one revenue. Volume is the cure for high fixed costs.
The lowest cash point occurs in May 2026, with a balance of $1,163,000, suggesting the model assumes a large initial cash injection or loan. Since the unit is profitable almost immediately, the runway is about funding the growth of the sales team and facilitator pool. We defintely recommend maintaining a 3-month buffer of fixed costs ($21,000+) to handle seasonal lulls. Cash flow is the lifeblood of your operation.

In a High scenario, increasing corporate contracts by 20% dramatically boosts the year-one $134,000 EBITDA because fixed costs like rent and base salaries are already covered. Conversely, a Low scenario where sales lag by 20% tests the 2-year payback period, as the 19.75% royalty remains a constant drag on margin regardless of performance. Scenarios turn 'what-ifs' into actionable plans.
This Excel-based franchise financial model template gives you total control over your executive training unit's projections. You can adjust every variable, from program tuition rates to facilitator staffing levels, ensuring the numbers reflect your specific territory's demand. It is built to handle the nuances of a service-based business where human capital is the primary driver. One size never fits all in leadership training.

Planning for a leadership training business requires looking beyond the first few contracts. This model provides a detailed 5-year outlook, showing how revenue scales from $725,000 in year one to over $2 million by year five. By tracking the long-term interaction between corporate contracts and recurring retainer partnerships, you can defintely see the path to a mature, high-margin operation. Growth is a marathon, not a sprint.

Royalties in this model are significant, set at 19.75% of gross sales. This franchise investment analysis ensures you account for every dollar sent to the franchisor before you calculate your take-home pay. Since there is currently a 0% marketing fund contribution, the model focuses heavily on how that high royalty impacts your store-level EBITDA (earnings before interest, taxes, depreciation, and amortization). Know your overhead before you open your doors.

Launching an executive hub requires a clear franchise startup cost calculator. With an initial franchise fee of $75,000 and roughly $36,919 in physical build-out and equipment, you need to know exactly when the business pays for itself. The model identifies the specific volume of program tuitions and corporate contracts needed to cover your $4,200 monthly rent and $17,500 base monthly payroll. Precision in the startup phase prevents cash crunches later.

Don't guess on your margins. This franchise unit economic analysis template includes benchmarks for professional service franchises, helping you evaluate if your 3.5% training material cost or your facilitator pay scales are in line with the market. Comparing your projected $134,000 year-one EBITDA against industry standards helps ensure your business plan is grounded in reality. Real-world data beats gut feelings every time.


Simply purchase and download the financial model template, then access it instantly using Microsoft Excel or Google Sheets. No installation or technical expertise required-just open and start working.

Enter your business-specific numbers, including revenue projections, costs, and investment details. The pre-built formulas will automatically calculate financial insights, saving you time and effort.

Leverage the investor-ready format to confidently showcase your financial projections to banks, franchise representatives, or investors. Impress stakeholders with clear, data-driven insights and professional reports.

Leverage the investor-ready format to confidently present your projections to banks, franchise representatives, or investors.