
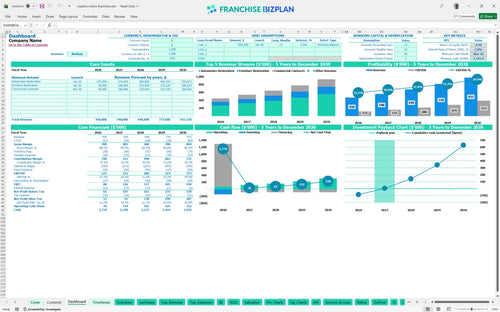
All-in-one Dashboard
Core inputs and core outputs


This mobile service franchise financial model provides a complete toolkit for analyzing unit-level performance from day one through year five.
Core inputs and core outputs
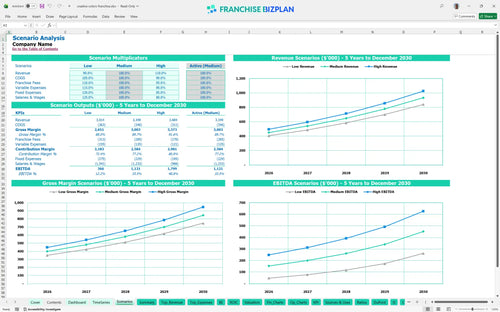
Three scenario analysis
Presentation ready
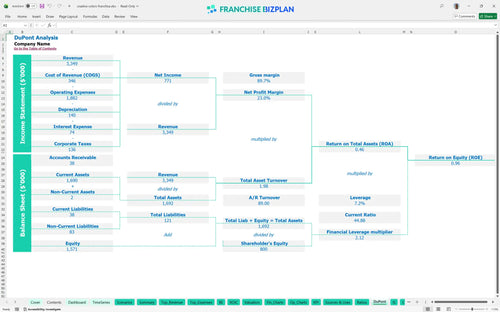
DuPont analysis
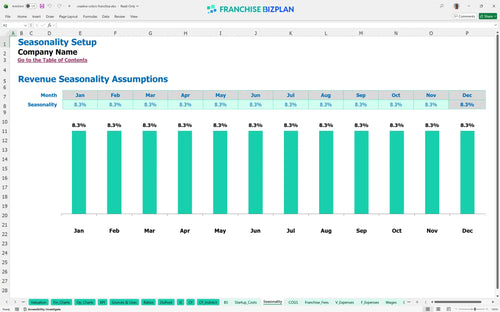
Researched revenue assumptions
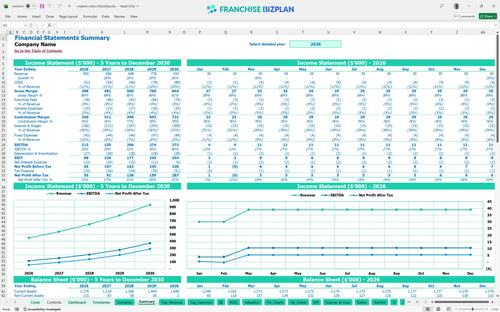
Lender-friendly financial outputs
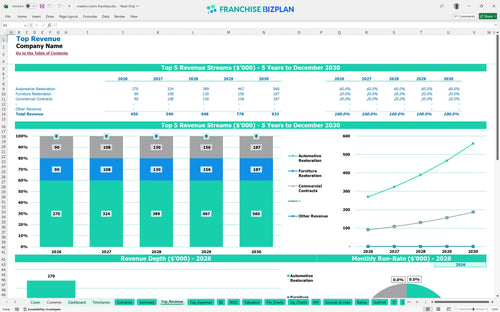
Revenue stream detailed view
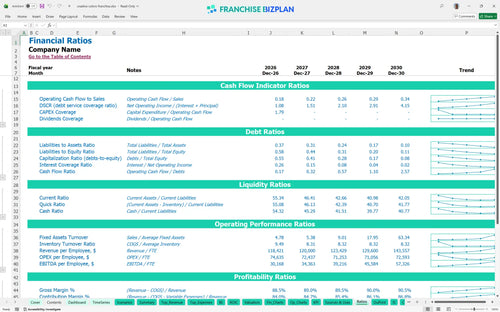
Performance metrics benchmark
We built this model using detailed research into the restoration service sector to ensure accuracy. Key assumptions, including the $450,000 year-one revenue and $115,000 EBITDA, are pre-populated and fully editable to match your specific territory. This data-driven approach helps you evaluate the real-world potential of a mobile restoration unit without the fluff.
Evaluating profitability of mobile repair service franchise units shows that this model hits profitability in year one, with an initial EBITDA of $115,000. By year five, as you optimize your recurring revenue model and scale your technician team, annual EBITDA is projected to reach $373,000. Profit isn't just about sales; it's about how many stops your van makes per day. This franchise unit profitability calculator ensures you track the right drivers.
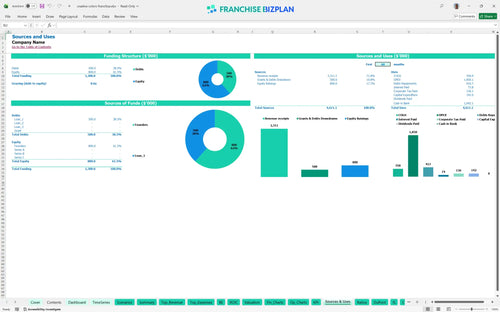
Knowing how to calculate startup costs for a mobile franchise is the first step toward a successful launch. You will need approximately $142,000 in initial capital to cover the franchise fee, mobile van, and equipment. This model defintely accounts for every dollar, from the $59,500 entry fee to the $3,000 required for vehicle branding and initial marketing materials.
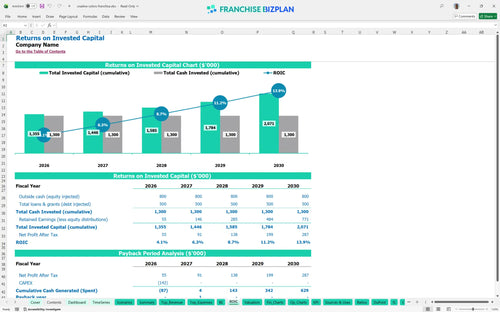
An ROI analysis for home-based service franchise units reveals a 2-year payback period and an internal rate of return (IRR) of 6.98%. With a return on equity (ROE) of 0.96, the model demonstrates a stable path for investors looking for a service-based business with consistent demand. A 2-year payback is a strong signal for a service-based model in the current market. This franchise investment ROI view helps you communicate value to lenders or partners.
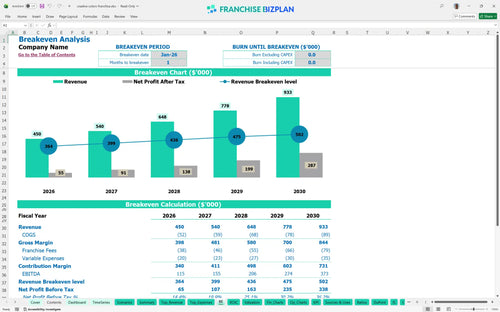
The franchise break-even analysis indicates that the unit can reach its break-even point as early as January 2026, just one month after launch. This rapid transition is driven by low fixed overhead and the ability to start generating revenue immediately through automotive and furniture restoration. Hitting break-even in month one is rare but possible with pre-sold B2B contracts and efficient scheduling.
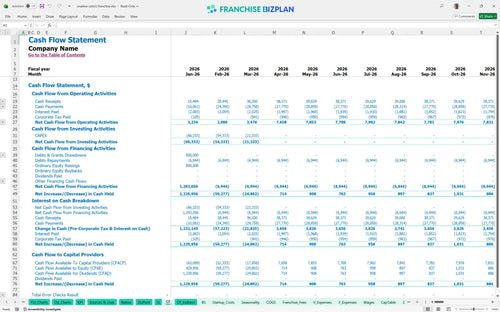
The franchise unit cash flow projection spreadsheet identifies the lowest cash point in March 2026, with a minimum cash requirement of $1,146,000. This significant buffer ensures you can handle the ramp-up of field technicians and administrative support without risking operations. Cash is oxygen, and this high liquidity buffer ensures you won't run out during the critical first year.
This financial model for leather restoration service business units allows you to toggle between Low, Medium, and High scenarios to see how revenue shifts impact your bottom line. A high-performance scenario focuses on maximizing the $373,248 automotive restoration stream, while a low scenario helps you plan for slower B2B contract adoption. The difference between a hobby and a business is your technician's billable hours.
This franchise financial model template is a fully editable Excel framework designed for precision and flexibility. You can adjust pre-filled formulas and assumptions to match your specific territory, allowing for a custom view of your location's unique operating scenario. Using this Excel template for franchise unit financial forecasting ensures your numbers are grounded in reality rather than guesswork.

Planning for a multi-unit future requires a detailed franchise business plan financial projection that spans five years. This model maps out revenue, costs, and cash flow from your first van to a mature operation, helping you visualize the path to a $933,000 annual revenue target by year five. It serves as a financial planning guide for new franchise owners who need to see the long-term impact of today's hiring and equipment decisions.

Managing franchise royalty fees is critical for protecting your store-level margin. This model automatically calculates the 7.5% royalty and 1% marketing fund contributions based on your monthly sales, so you always know exactly what is owed to the franchisor. Learning how to forecast franchise royalty and advertising fees correctly prevents cash flow surprises as your volume scales from $450,000 to over $900,000.

Our franchise startup cost spreadsheet breaks down the $142,000 initial investment into clear categories like the $59,500 franchise fee and $45,000 mobile service van. This tool provides a clear break-even analysis, showing you the exact sales volume needed to cover your $1,500 monthly vehicle lease and other fixed costs. Using a spreadsheet for tracking franchise operating expenses helps you keep a tight grip on your burn rate during the ramp-up phase.

This model incorporates built-in benchmarks for operating expenses for mobile business units, such as restoration chemicals starting at 10% of sales. These metrics allow you to sanity-check your labor costs and fuel expenses against industry standards to ensure your unit remains competitive. Comparing your performance to these benchmarks is essential for maintaining a healthy EBITDA as your field technician team grows.


Simply purchase and download the financial model template, then access it instantly using Microsoft Excel or Google Sheets. No installation or technical expertise required-just open and start working.

Enter your business-specific numbers, including revenue projections, costs, and investment details. The pre-built formulas will automatically calculate financial insights, saving you time and effort.

Leverage the investor-ready format to confidently showcase your financial projections to banks, franchise representatives, or investors. Impress stakeholders with clear, data-driven insights and professional reports.

Leverage the investor-ready format to confidently present your projections to banks, franchise representatives, or investors.