
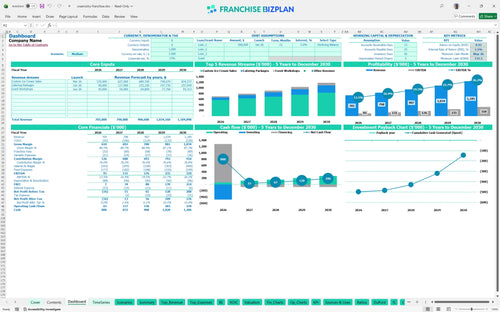
All-in-one Dashboard
Core inputs and core outputs


This retail franchise financial template provides a comprehensive framework for analyzing the unit economics, cash flow, and long-term investment returns of a nitrogen-based dessert location.
Core inputs and core outputs
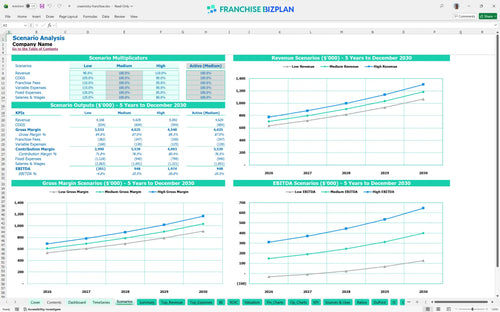
Three scenario analysis
Presentation ready
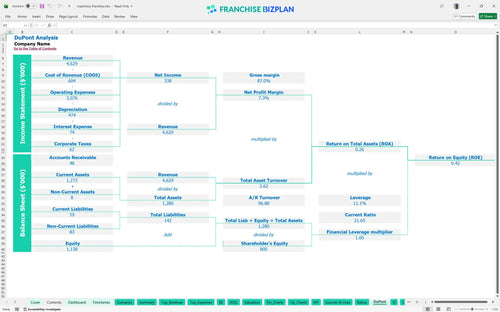
DuPont analysis
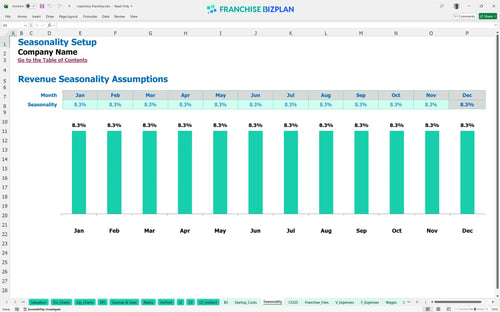
Researched revenue assumptions
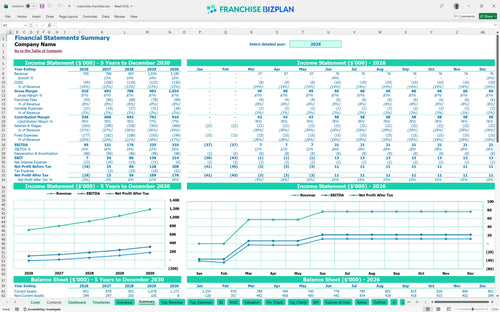
Lender-friendly financial outputs
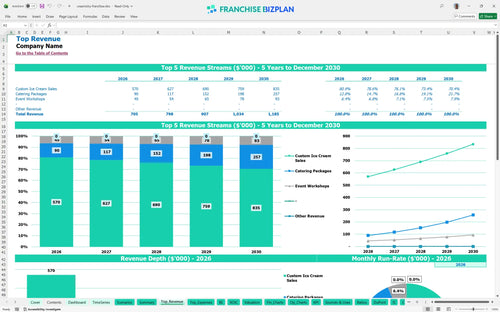
Revenue stream detailed view
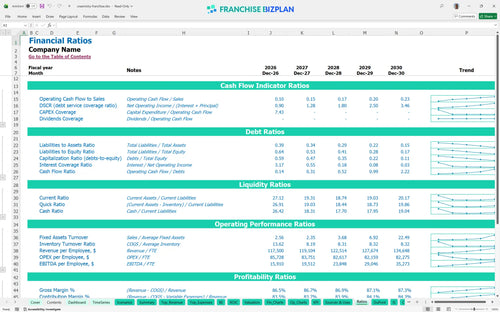
Performance metrics benchmark
We developed this financial model through extensive research into nitrogen-based dessert operations to provide a realistic roadmap for prospective owners. The tool comes pre-populated with key data, including a $705,000 year-one revenue target and $95,000 in initial EBITDA, all of which you can customize to fit your specific market and site selection.
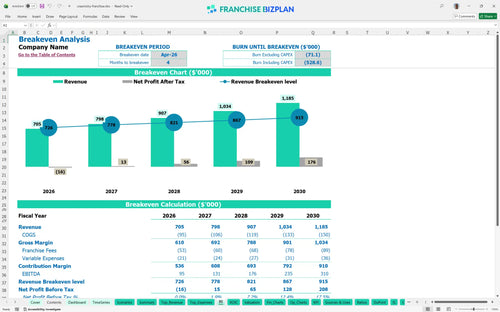
Profitability for this ice cream franchise business plan starts with a four-month sprint to breakeven by April 2026. Based on our franchise profitability analysis, the unit generates $95,000 in EBITDA during the first year, eventually scaling to $310,000 as catering and workshop revenue streams mature.
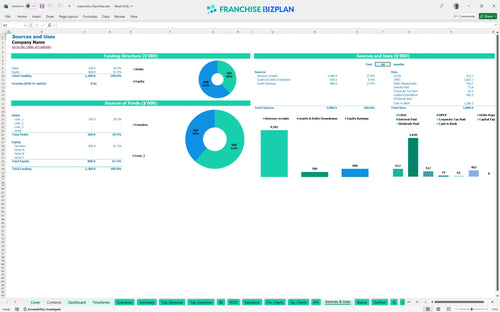
To calculate startup costs for a food franchise like this, you must account for over $480,000 in initial capital expenditure, including specialized nitrogen systems and leasehold improvements. This financial model template for retail store operations breaks down how the $40,000 franchise fee and build-out costs impact your initial liquidity.
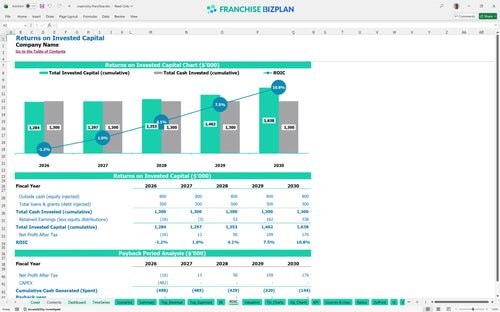
Our franchise unit financial forecasting spreadsheet shows an IRR of 1.47% and a Return on Equity of 0.42, which are critical for any ROI calculation. While the operating budget template for franchise owners shows strong cash flow, the high initial cost of goods sold analysis for ice cream shop equipment means full payback occurs after year five.
The break-even analysis identifies April 2026 as the point where revenue covers the $9,500 monthly rent and 7.5% combined franchise royalty fees and marketing contributions. Estimating profitability for a dessert franchise requires maintaining high throughput to offset these fixed operating expenses.
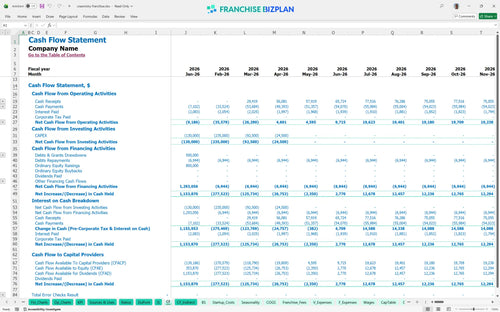
The lowest cash point hits in May 2026 at $722,000, meaning you defintely need to secure your funding sources before the February equipment payments. Use this franchise business model financial spreadsheet to monitor how the timing of leasehold improvements affects your cash runway during the ramp-up phase.
Financial projections for new franchise location success depend on hitting the high-revenue scenario through aggressive local marketing and event workshops. This ice cream shop business plan excel tool allows you to stress-test how a 10% drop in custom ice cream sales impacts your ability to analyze franchise investment returns.
This franchise financial model is built in Excel with fully editable assumptions and pre-filled formulas, allowing you to adjust every variable from nitrogen supply costs to local labor rates. You can easily modify the revenue drivers and expense categories to match your specific territory or real estate requirements without breaking the underlying logic.

The model provides a detailed five-year outlook, tracking revenue growth from $705,000 in year one to over $1.18 million by year five. It maps out the long-term scaling of EBITDA and cash flow, giving multi-unit operators and lenders a clear view of the unit's maturation and profit potential over a standard franchise term.

Managing ongoing obligations is simple with dedicated inputs for the 6% royalty fee and 1.5% marketing fund contribution. The model automatically calculates these expenses against gross sales, ensuring you understand the impact of franchisor fees on your monthly store-level margins and bottom-line performance.

Plan your entry with confidence by analyzing the total initial investment required for build-out, equipment, and fees. The model identifies the exact sales volume needed to cover your $9,500 monthly rent and other fixed costs, helping you target the specific traffic levels required for operational stability.

We have integrated researched benchmarks for labor, occupancy, and ingredient costs to help you sanity-check your projections. By comparing your expected 11% ingredient cost and staffing plan against industry standards, you can identify margin leaks before they impact your cash position.


Simply purchase and download the financial model template, then access it instantly using Microsoft Excel or Google Sheets. No installation or technical expertise required-just open and start working.

Enter your business-specific numbers, including revenue projections, costs, and investment details. The pre-built formulas will automatically calculate financial insights, saving you time and effort.

Leverage the investor-ready format to confidently showcase your financial projections to banks, franchise representatives, or investors. Impress stakeholders with clear, data-driven insights and professional reports.

Leverage the investor-ready format to confidently present your projections to banks, franchise representatives, or investors.