
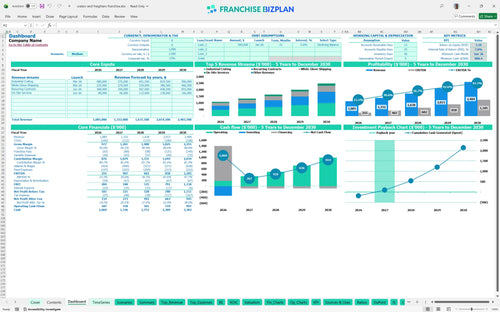
All-in-one Dashboard
Core inputs and core outputs


This franchise unit financial model template provides a complete Excel-based toolkit for forecasting revenue, expenses, and cash flow for a specialized logistics business.
Core inputs and core outputs
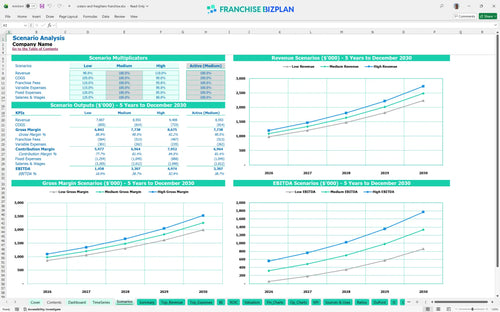
Three scenario analysis
Presentation ready
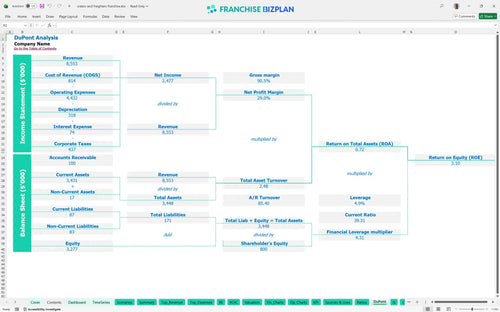
DuPont analysis
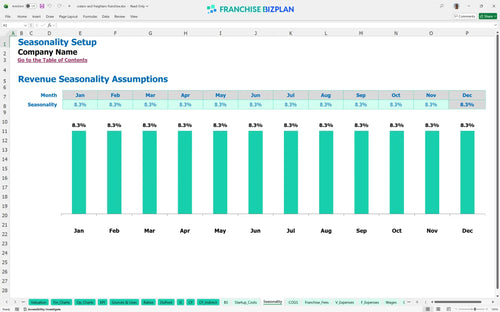
Researched revenue assumptions
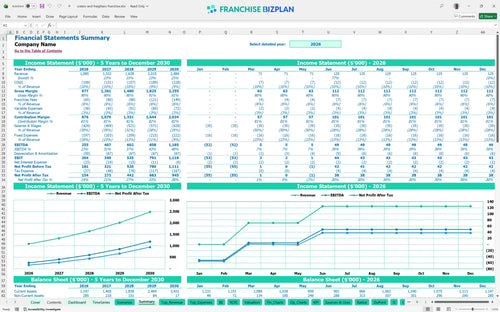
Lender-friendly financial outputs
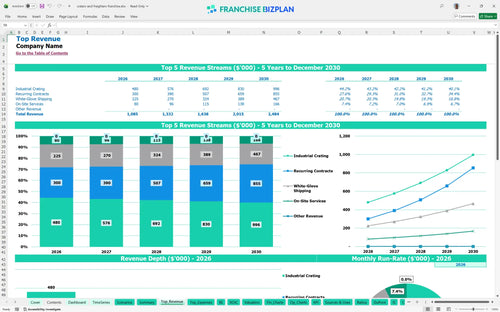
Revenue stream detailed view
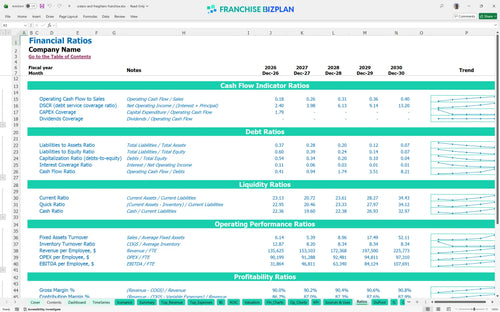
Performance metrics benchmark
We built this franchise unit financial model using our own research into specialized logistics and industrial crating. The pre-populated data covers everything from $335,000 in initial capital needs to the 5% royalty structure, and it is all fully editable. You can test how different revenue streams, like recurring contracts starting at $200,000, affect your year-one EBITDA of $255,000.
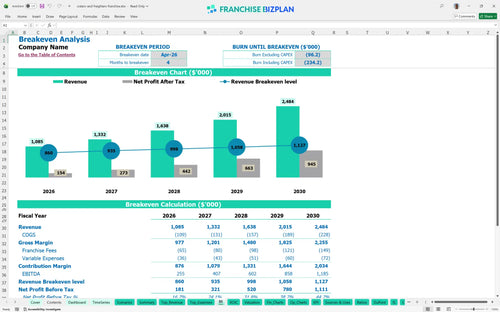
The unit becomes profitable by April 2026, just four months after launching operations. This quick transition is driven by high-margin industrial crating and white-glove shipping services that offset the 5% royalty and fixed overhead. Profitability is defintely tied to how fast you can secure recurring contracts, which are projected to hit $200,000 in the first year.
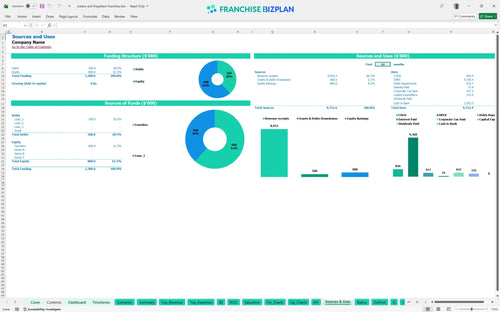
You will need approximately $335,000 to launch this franchise unit in the US. This capital covers the $35,000 franchise fee, a $120,000 warehouse build-out, and $50,000 for delivery vehicles. The model also includes $15,000 for initial materials inventory to ensure you can start custom crating immediately upon opening.
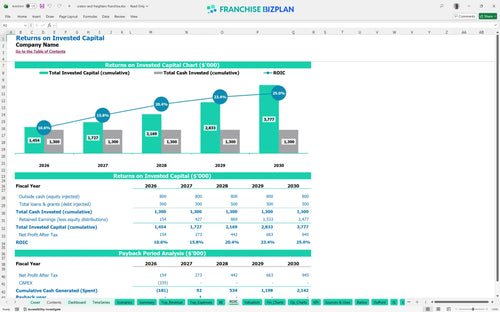
Franchisees can expect a 2-year payback period and an Internal Rate of Return (IRR) of 7.84%. The Return on Equity (ROE) stands at 3.1, reflecting the asset-heavy nature of the logistics and shipping industry. These returns depend on hitting the $1.08M revenue target in year one while maintaining a strong EBITDA margin of 23.5%.
The monthly break-even revenue is approximately $31,500, which covers $16,400 in fixed costs including rent and insurance. The primary driver for reaching this point is volume in industrial crating, as materials represent about 8% of your costs. Managing the schedule of your three crating specialists is the most effective way to protect your margin during the ramp-up phase.
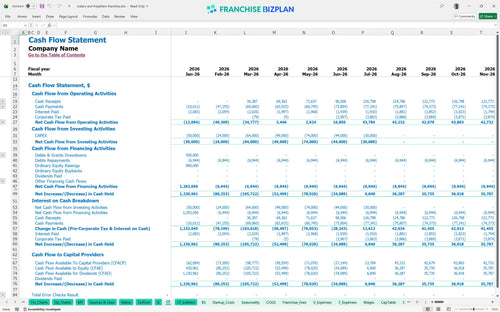
The lowest cash point occurs in June 2026, requiring a minimum cash buffer of $880,000 to handle the initial build-out and early operating losses. You should plan for at least six months of runway to cover the gap between job completion and payment collection. This buffer ensures you can maintain payroll for your operations manager and drivers while scaling the business.
A High scenario, driven by increased demand from the tech corridor, can push year-one revenue well beyond $1.08M and shorten the payback period. Conversely, a Low scenario with a 10% revenue drop would delay break-even and increase the peak cash need. The model allows you to test these sensitivities to see how labor productivity and local marketing execution impact your bottom line.
Finance: update unit break-even and payback model by Friday.
This franchise unit financial model is fully customizable in Excel, featuring pre-filled formulas and editable assumptions that allow you to adapt the numbers to your specific territory. Whether you are adjusting for local labor rates or specific warehouse lease terms, the model handles the complex math so you can focus on the logistics. It is a flexible franchise financial model template designed to scale with your business goals.

Long-term planning is essential for a logistics franchise startup costs analysis, and this model provides a detailed 5-year roadmap. You can project revenue growth from $1.08M in year one to over $2.48M by year five, accounting for the ramp-up of recurring contracts and on-site services. This franchise profitability analysis helps you visualize the path from initial investment to mature-unit performance.

This model accurately captures your ongoing financial obligations, including the 5% royalty and 1% brand marketing fund contributions. By tracking these against your gross sales, you can see the real-world impact on your store-level margin. Understanding these franchise-specific costs is vital for any franchisee evaluating the true economics of a crating and shipping franchise investment.

Estimating your total initial investment is the first step in any franchise investment feasibility study template. This model breaks down the $335,000 required for build-out, equipment, and fees, while identifying the exact sales volume needed to cover your $16,400 monthly fixed costs. It provides a clear view of your break-even point, helping you manage working capital during the critical early months.

The model incorporates industry-specific benchmarks for white-glove logistics franchise operating expenses to help you sanity-check your projections. If your crating material costs or labor percentages drift too far from the 8% material target, you can quickly identify the leak. These benchmarks provide a reliable baseline for your financial projections spreadsheet, ensuring your business plan is grounded in reality.


Simply purchase and download the financial model template, then access it instantly using Microsoft Excel or Google Sheets. No installation or technical expertise required-just open and start working.

Enter your business-specific numbers, including revenue projections, costs, and investment details. The pre-built formulas will automatically calculate financial insights, saving you time and effort.

Leverage the investor-ready format to confidently showcase your financial projections to banks, franchise representatives, or investors. Impress stakeholders with clear, data-driven insights and professional reports.

Leverage the investor-ready format to confidently present your projections to banks, franchise representatives, or investors.