
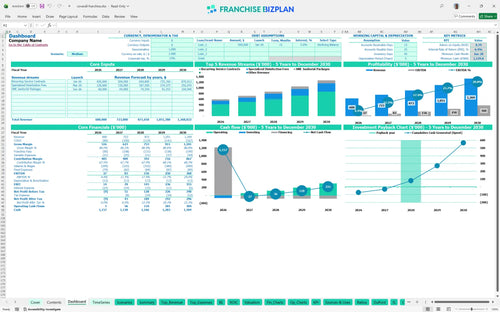
All-in-one Dashboard
Core inputs and core outputs


This excel template for janitorial franchise profit and loss includes automated pro-forma statements, estimating labor costs for specialized disinfection services, and detailed CAPEX schedules to manage your cleaning business startup cost spreadsheet.
Core inputs and core outputs
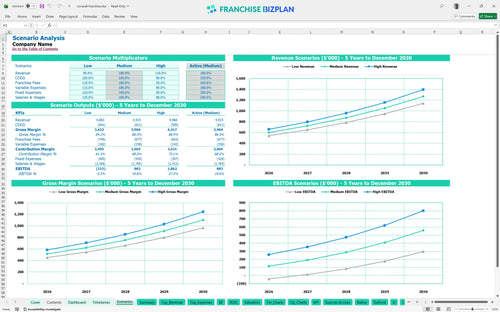
Three scenario analysis
Presentation ready
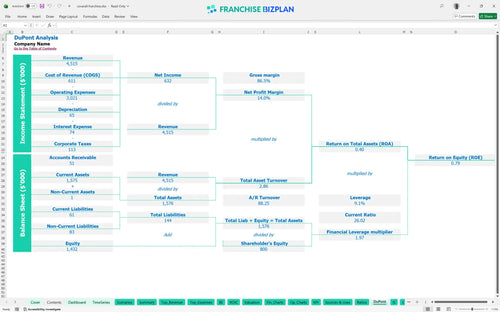
DuPont analysis
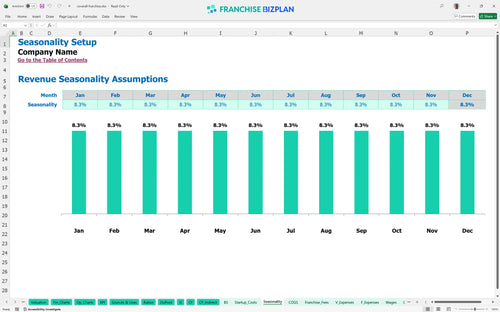
Researched revenue assumptions
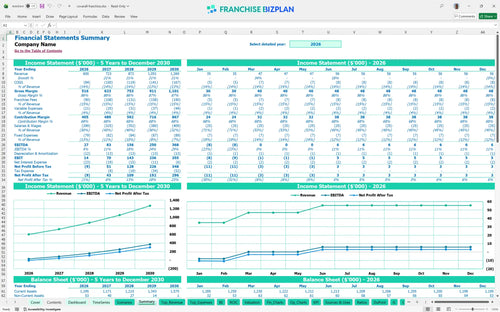
Lender-friendly financial outputs
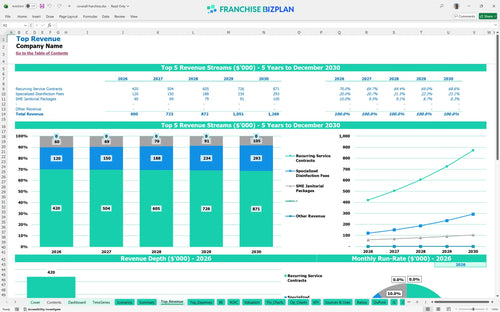
Revenue stream detailed view
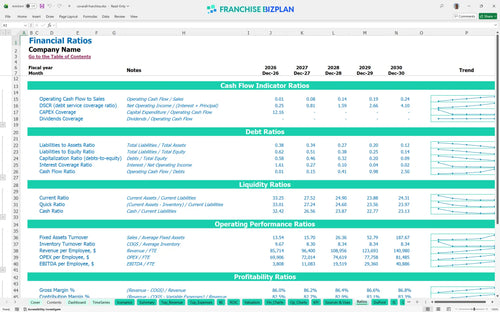
Performance metrics benchmark
We built this commercial cleaning business unit financial model using our own research into the Austin market and janitorial cost structures. Key assumptions like the $600,000 year-one revenue and the 15% combined royalty and marketing fees are pre-populated with researched data specific to this janitorial franchise unit and are fully editable. This tool provides a clear view of how commercial janitorial service revenue streams scale over a five-year period.
You will see a positive EBITDA of $27,000 in your first year, but the real acceleration happens in year three when earnings hit $156,000. This assumes you hit your recurring contract targets and keep green cleaning supplies around 11% of sales while managing a team of four technicians.
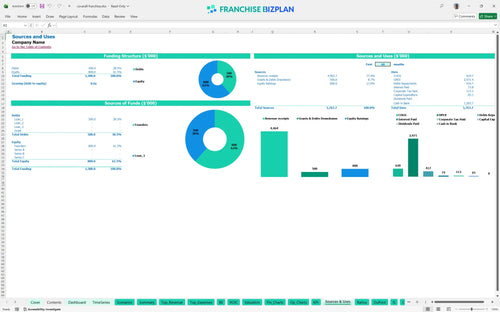
You will need approximately $65,320 in initial capital to cover the franchise fee, specialized equipment, and service vehicles required for launch. This financial feasibility study for cleaning service franchise units ensures you account for every dollar from office computers to initial supplies inventory during the ramp-up.
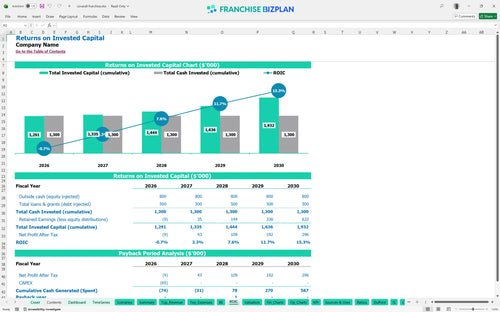
This cleaning franchise investment return analysis projects a 6.4% Internal Rate of Return and a Return on Equity of 0.79 over five years. With a three-year payback period, the model demonstrates how initial investments transition into a $368,000 annual EBITDA by the end of year five.
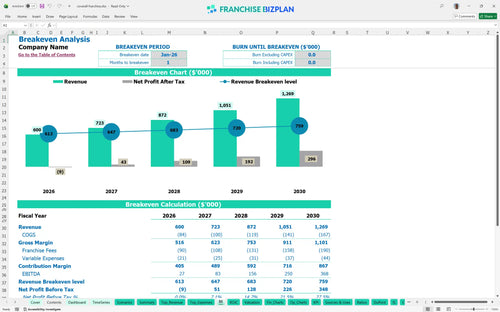
The unit hits break-even in January 2026, just one month after launch, assuming you deploy your cleaning contract pricing strategy effectively from day one. This rapid transition depends on maintaining a tight 15% cap on franchise-related fees while managing your $3,200 monthly warehouse rent and fixed utility costs.
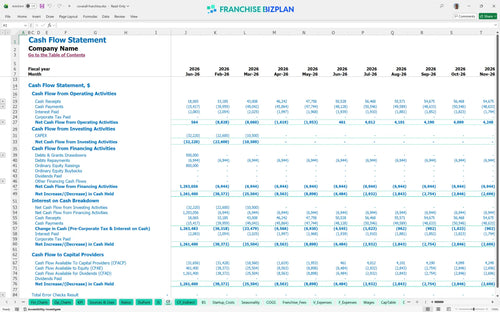
Knowing how to forecast cash flow for a new franchise unit is vital, as your lowest cash point is projected at $1,130,000 in January 2028. This reflects the capital needed to support the $403,200 in recurring service revenue expected that year while scaling your technician fleet to five full-time employees.
Forecasting recurring revenue for commercial janitorial contracts requires testing Low, Medium, and High cases to see how a 10% revenue swing affects your $250,000 year-four EBITDA. High-case outcomes depend on your ability to upsell specialized disinfection fees, which are projected to grow from $80,000 to $195,313 over five years.
Finance: update unit break-even and payback model by Friday.
This janitorial franchise financial model lives in Excel, giving you total control over every line item from green cleaning supplies to local labor rates. You can swap out pre-filled data for your specific Austin territory or adjust the ramp-up speed to see how it hits your bottom line. Honestly, the ability to tweak operating expenses for cleaning business units is what separates a guess from a real plan.

Most owners fail because they only look at month one, but this commercial cleaning franchise business plan maps out your path through 2030. With revenue projected to grow from $600,000 in year one to $1.269M by year five, you can visualize the compounding effect of recurring service contracts. Plus, small business financial forecasting helps you spot capital needs before they become emergencies.

Managing franchise royalty and fee structures in excel is critical because these costs come off the top before you pay a single cleaner. This model tracks the 5% royalty and 10% marketing fee against your gross sales, ensuring you know exactly how much stays in your pocket after brand obligations. Still, a precise franchise royalty fee calculation is the only way to protect your store-level margin.

Figuring out how to calculate startup costs for a commercial cleaning franchise shouldn't be a guessing game. We've detailed everything from the $15,570 initial fee to the $18,000 for service vehicles, showing you the exact sales volume needed to cover your $3,200 monthly rent and fixed overhead. Every 1-point margin leak matters fast in a single-unit model, so watch those supply costs.

Use this franchise profitability analysis tool to compare your projected 11% supply cost against industry standards for green cleaning. It helps you defintely spot if your labor spend or chemical usage is out of whack compared to high-performing units in similar commercial corridors. Following best practices for franchise unit financial planning means using real-world numbers, not just best-case scenarios.


Simply purchase and download the financial model template, then access it instantly using Microsoft Excel or Google Sheets. No installation or technical expertise required-just open and start working.

Enter your business-specific numbers, including revenue projections, costs, and investment details. The pre-built formulas will automatically calculate financial insights, saving you time and effort.

Leverage the investor-ready format to confidently showcase your financial projections to banks, franchise representatives, or investors. Impress stakeholders with clear, data-driven insights and professional reports.

Leverage the investor-ready format to confidently present your projections to banks, franchise representatives, or investors.