
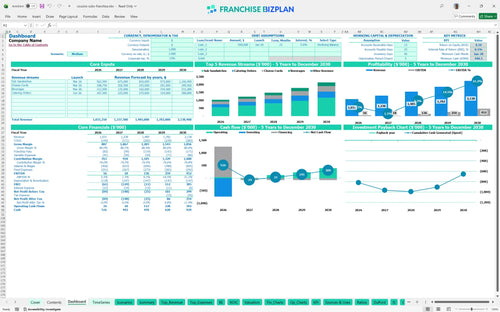
All-in-one Dashboard
Core inputs and core outputs


This financial model template for fast casual restaurant operations includes everything from CAPEX tracking to multi-year cash flow forecasting for a single franchise location.
Core inputs and core outputs
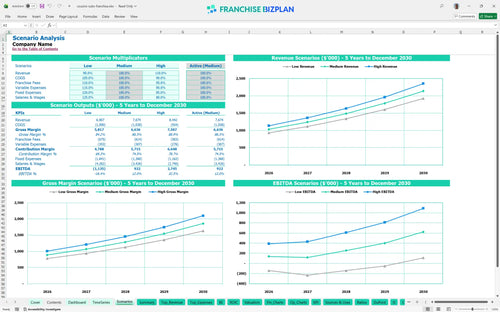
Three scenario analysis
Presentation ready
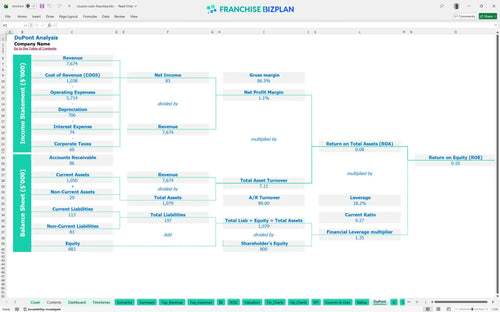
DuPont analysis
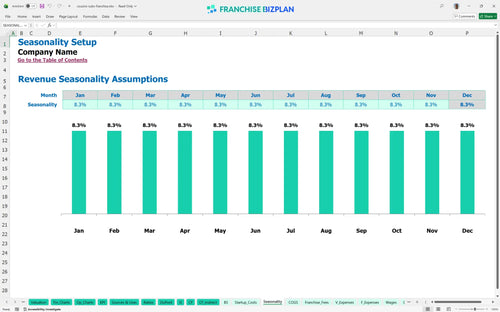
Researched revenue assumptions
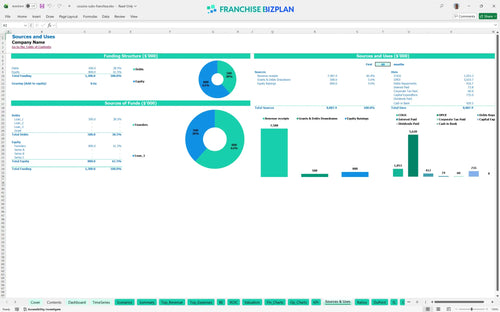
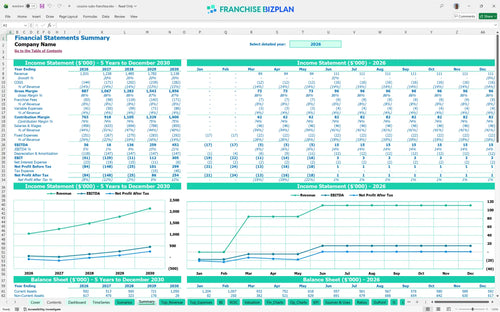
Lender-friendly financial outputs
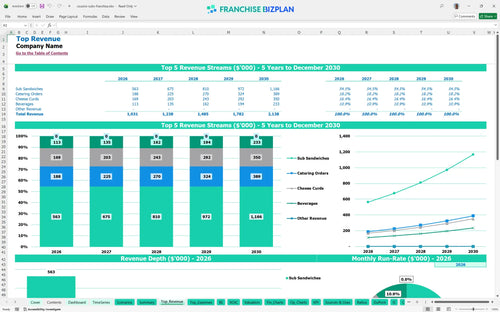
Revenue stream detailed view
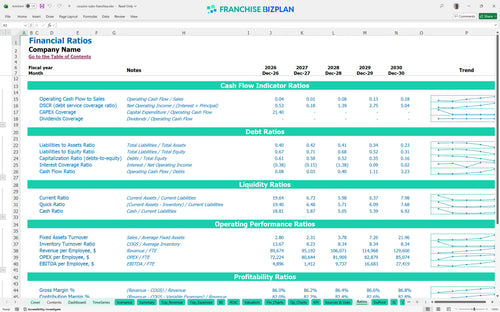
Performance metrics benchmark
We developed this franchise unit financial model based on detailed research into the sandwich shop sector. All key assumptions, including the $1,031,000 year-one revenue and 8% total brand fees, are pre-populated and fully editable to help you build a precise pro forma for a franchise unit.
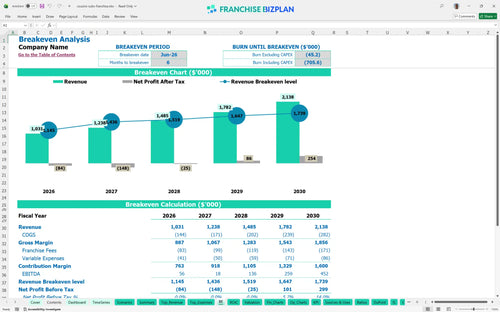
This sandwich franchise unit is projected to reach monthly profitability by June 2026, just six months after its launch. While year-one EBITDA starts at $56,000, the model defintely shows scaling potential as annual revenue climbs toward $2.1 million by year five.
You will need approximately $735,000 in total startup costs for this deli franchise location. This investment covers the $25,000 franchise fee, $350,000 for leasehold improvements, and $175,000 for essential kitchen equipment to meet brand standards.
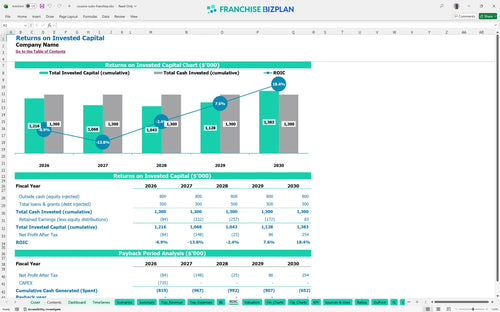
An owner can expect an Internal Rate of Return (IRR) of 15% and a Return on Equity (ROE) of 10%. Given the initial investment, the payback period is estimated to occur after year five as annual EBITDA reaches $452,000.
The unit reaches break-even in June 2026, requiring enough volume to cover $15,000 in monthly rent and $2,500 in utilities. The biggest driver for hitting this goal is maintaining high throughput during peak lunch hours to offset the 8% royalty and marketing burden.
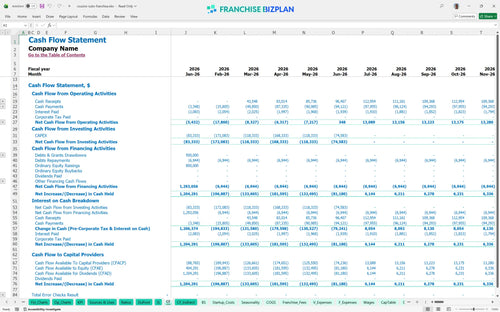
The lowest cash point occurs in January 2028, with a minimum cash requirement of $440,000. This suggests you need a solid capital buffer to handle the ramp-up phase and the timing of your $735,000 total initial investment.
In the High scenario, leveraging catering revenue-which grows to $388,800 annually-significantly boosts the year-five EBITDA. The Low scenario warns that if sub sandwich sales underperform the $375,000 year-one target, the $15,000 fixed rent will tighten margins quickly.
This franchise financial model is built in Excel with fully editable assumptions, allowing you to adjust every variable from local labor rates to specific rent costs. You can modify pre-filled formulas to test different operating scenarios, ensuring the projections align with your specific territory and market conditions.

Long-term planning is essential for a fast casual restaurant business plan, and this model provides a detailed 5-year outlook. It maps out revenue growth from $1.03 million to over $2.1 million, tracking how store-level EBITDA (earnings before interest, taxes, depreciation, and amortization) evolves as the unit matures.

Operating a franchise means managing specific financial obligations like the 6% royalty and 2% marketing fund contributions. This model captures these ongoing costs automatically, showing you the real economics of the unit after all brand-level fees are paid from your gross sales.

Use this franchise startup costs template to estimate your total initial investment, including the $350,000 build-out and $175,000 in kitchen equipment. The integrated break-even analysis identifies the exact sales volume required to cover your $15,000 monthly rent and other fixed operating expenses.

This restaurant profitability analysis tool includes built-in benchmarks to help you sanity-check your numbers against industry standards. By comparing your food costs and labor percentages to typical ranges, you can identify margin leaks and optimize your restaurant franchise operating budget spreadsheet.


Simply purchase and download the financial model template, then access it instantly using Microsoft Excel or Google Sheets. No installation or technical expertise required-just open and start working.

Enter your business-specific numbers, including revenue projections, costs, and investment details. The pre-built formulas will automatically calculate financial insights, saving you time and effort.

Leverage the investor-ready format to confidently showcase your financial projections to banks, franchise representatives, or investors. Impress stakeholders with clear, data-driven insights and professional reports.

Leverage the investor-ready format to confidently present your projections to banks, franchise representatives, or investors.