
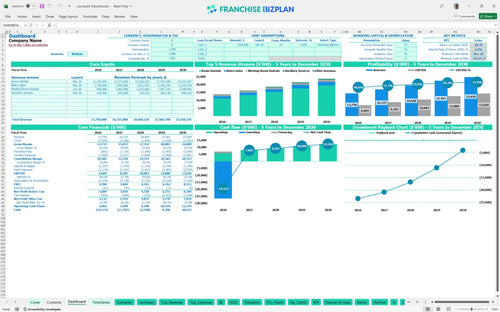
All-in-one Dashboard
Core inputs and core outputs


This comprehensive hotel franchise revenue projection spreadsheet provides everything a multi-unit operator needs to evaluate a new territory, from construction costs to five-year EBITDA targets.
Core inputs and core outputs
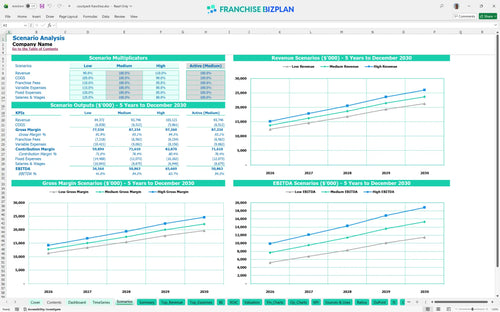
Three scenario analysis
Presentation ready
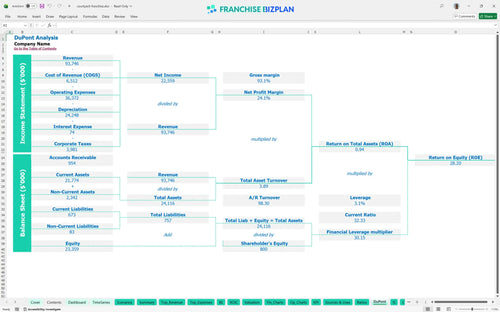
DuPont analysis
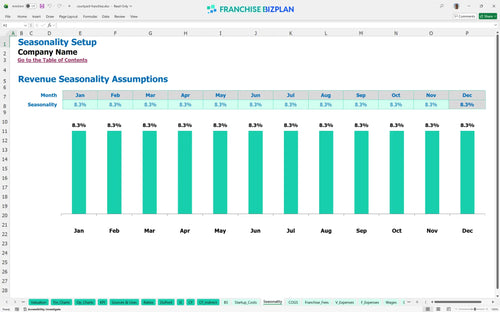
Researched revenue assumptions
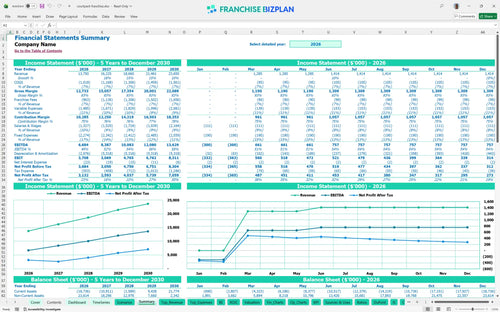
Lender-friendly financial outputs
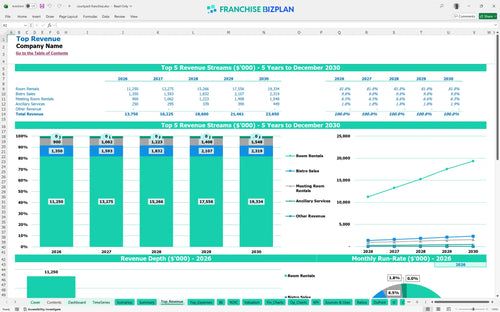
Revenue stream detailed view
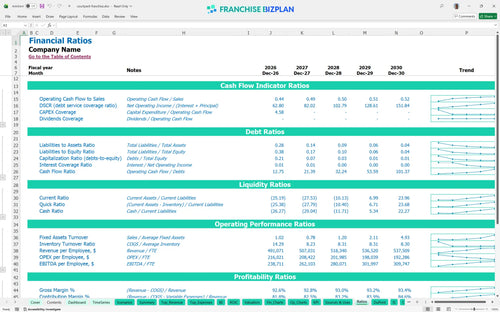
Performance metrics benchmark
We built this franchise unit financial model using our own research into the hospitality sector and premium brand standards. Key assumptions, including room rentals starting at $7.5M in year one and total EBITDA climbing to $13.6M by year five, are pre-populated and fully editable. This tool provides a realistic look at the $27.3M capital expenditure planning required for a high-tech urban hotel concept.
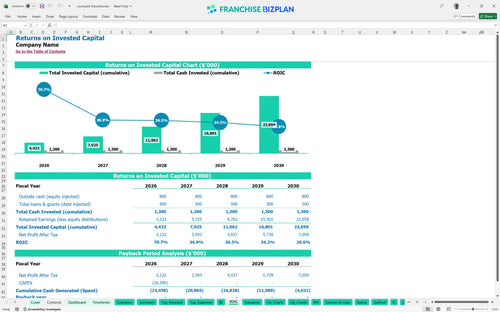
This franchise unit becomes operationally profitable by March 2026, just three months after opening. While EBITDA is positive in Year 1 at $6.6M, the model shows that reaching a full return on the $27M investment takes longer, with payback occurring after the fifth year of operations.
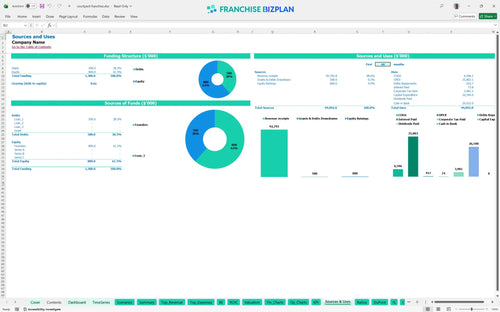
To launch this unit in the US, you need approximately $27.34 million in total initial capital. This hotel franchise investment return analysis excel shows that the vast majority of funds are allocated to building construction and site preparation, followed by furniture, fixtures, and equipment (FF&E).
Investors can expect an Internal Rate of Return (IRR) of 2.17% and a Return on Equity (ROE) of 28.2%. The cash flow is defintely strong, but the high entry cost means this is a long-term wealth-building play rather than a quick flip, as evidenced by the payback period extending beyond year five.
The monthly break-even point is reached within 3 months of opening, provided you hit your occupancy targets. The primary driver affecting your break-even speed is room rental volume, which must cover the $189,500 in monthly fixed costs like the $75,000 lease and $35,000 in property taxes.
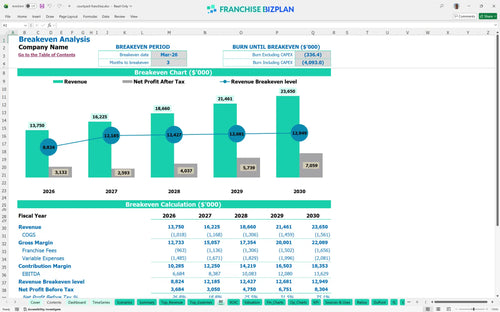
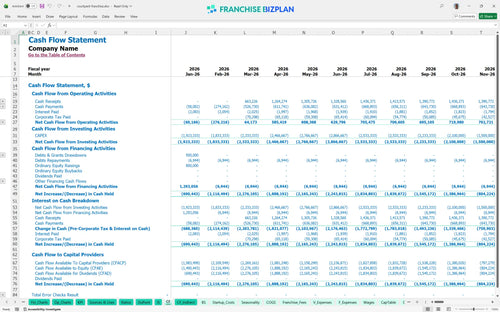
The lowest cash point is estimated at -$19.5M in December 2026, reflecting the peak of construction and pre-opening cash outflows. You will need a robust financing strategy and a cash buffer to handle the ramp-up phase until room revenue stabilizes in the second year.
A High scenario assumes faster occupancy growth, significantly improving the Year 1 $13.7M revenue baseline. Conversely, a Low scenario with higher OTA commissions or lower room rates would delay the break-even date and increase the peak cash need during the first 12 months of operation.
This hotel franchise financial model is fully customizable in Excel, featuring pre-filled formulas and editable assumptions that make it easy to adapt to your specific territory and operating scenario. You can adjust room rates, bistro margins, or staffing levels to see how local market shifts impact your bottom line.

Plan for the long haul with detailed 5-year revenue, cost, and cash flow projections tailored for a hospitality asset. This hotel business plan excel helps you visualize the transition from construction to a mature, high-occupancy property with clear year-over-year growth targets.

The model captures every financial obligation, from the $90,000 initial fee to the ongoing 6% royalty and 1% brand marketing fund. Budgeting for hotel franchise royalty and management fees ensures you understand the real economics of the unit after the brand takes its cut.

Use this franchise startup cost template to map out the significant $27.3 million initial outlay required for construction and site prep. It identifies the exact sales volume needed to cover your $189,500 monthly fixed cost burden, including the property lease and taxes.

We have incorporated built-in industry benchmarks for guest amenities and labor to help you sanity-check your hospitality revenue management assumptions. Comparing your 3.2% food cost or 4.2% amenity spend against typical mid-scale hotel franchise investment guide ranges keeps your forecast grounded.


Simply purchase and download the financial model template, then access it instantly using Microsoft Excel or Google Sheets. No installation or technical expertise required-just open and start working.

Enter your business-specific numbers, including revenue projections, costs, and investment details. The pre-built formulas will automatically calculate financial insights, saving you time and effort.

Leverage the investor-ready format to confidently showcase your financial projections to banks, franchise representatives, or investors. Impress stakeholders with clear, data-driven insights and professional reports.

Leverage the investor-ready format to confidently present your projections to banks, franchise representatives, or investors.