
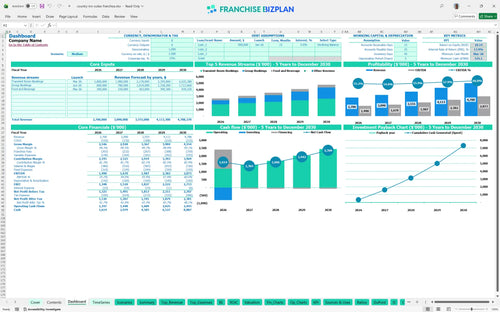
All-in-one Dashboard
Core inputs and core outputs


This hotel franchise financial model Excel template provides a detailed roadmap for tracking startup costs, operational margins, and long-term cash flow for a new hospitality unit.
Core inputs and core outputs
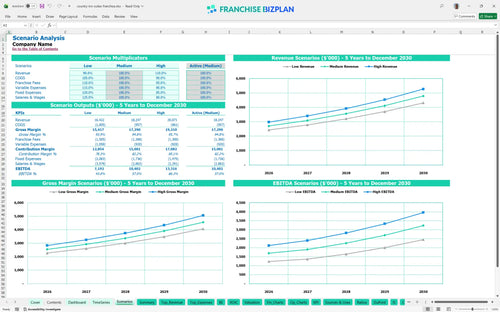
Three scenario analysis
Presentation ready
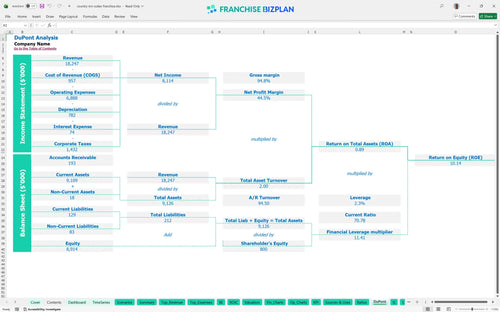
DuPont analysis
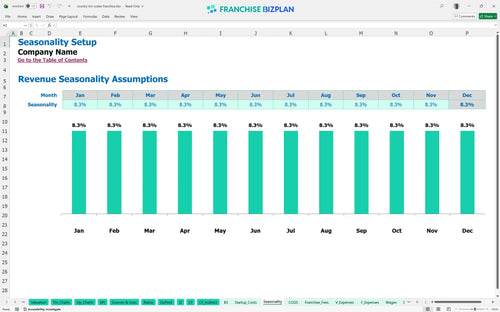
Researched revenue assumptions
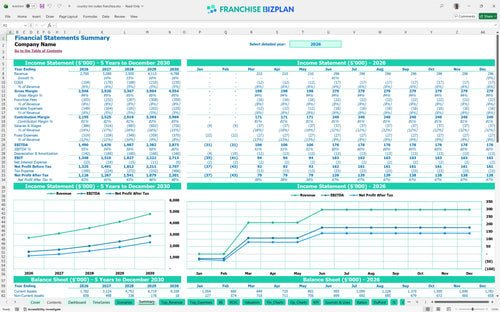
Lender-friendly financial outputs
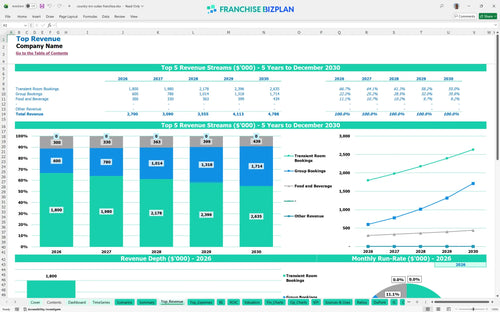
Revenue stream detailed view
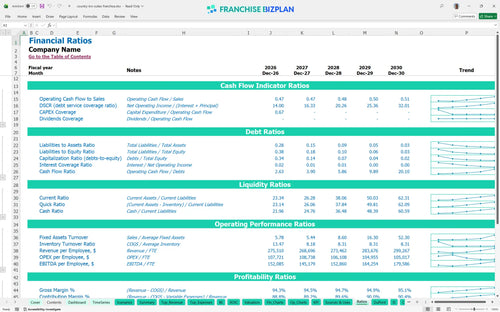
Performance metrics benchmark
We built this hotel franchise investment analysis using detailed research into the hospitality sector and midscale hotel operations. Key assumptions, including the $2.7 million year-one revenue and 5% royalty fees, are pre-populated with researched data and are fully editable to match your specific location and local demand.
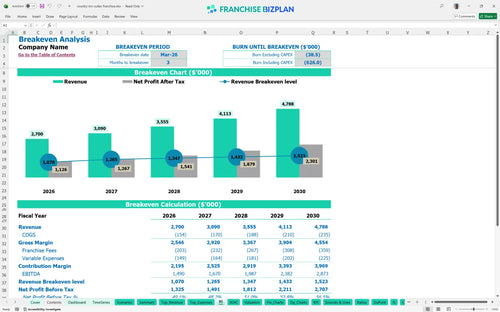
The unit is projected to reach an EBITDA of $1.49 million in its first year, with net profit scaling as group bookings and transient stays mature. You will defintely see profitability improve as revenue grows from $2.7 million in year one to $4.78 million by year five.
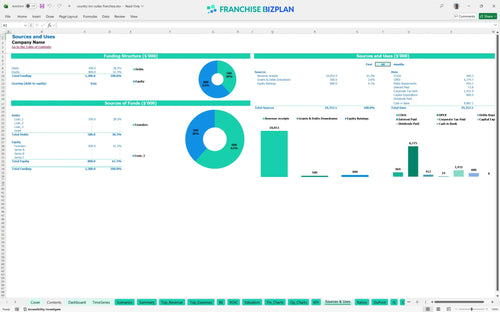
Launching this unit requires a total initial investment of approximately $1.325 million, which includes $800,000 in capital expenditures and a $525,000 cash buffer. This hotel franchise operating expense breakdown ensures you have enough liquidity to handle the initial three-month ramp-up period.
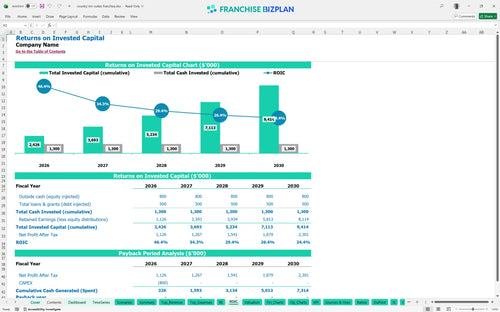
Investors can expect an Internal Rate of Return (IRR) of 13.92% and a Return on Equity (ROE) of 10.14%. While the initial outlay is significant, the franchise ROI calculation shows a steady climb in value, though full payback of the initial capital occurs after year five.
The unit hits its monthly break-even point in March 2026, just three months after opening. This quick transition is driven by strong transient room bookings and a lean initial staffing model, though high fixed costs like the $18,000 monthly rent remain the primary hurdle.
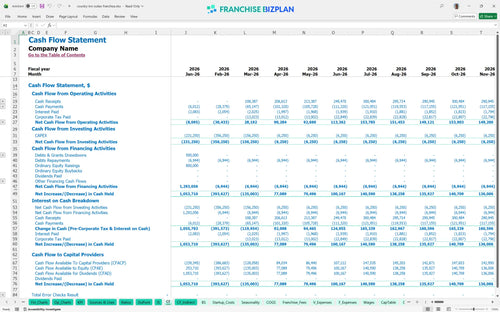
The lowest cash point occurs in March 2026 at $525,000, coinciding with the break-even month. Maintaining this minimum cash balance is critical to surviving the pre-opening phase and the first few months of guest acquisition before cash flow turns positive.
In the high-growth scenario, revenue scales toward $4.78 million by year five, significantly boosting the franchise unit profit and loss statement template results. The medium case assumes steady 10% growth, while the low case tests your ability to service debt if occupancy stays below 60%.
This hotel franchise financial model is built in Excel for maximum flexibility, allowing you to adjust every variable from occupancy rates to seasonal pricing. It functions as a franchise business plan template where all formulas are unlocked, so you can easily adapt the forcasts to your specific territory and local market conditions.

Success in the hospitality industry requires a long-term view of cash flow and asset appreciation. This tool provides detailed 5-year revenue and expense forcasts, helping you visualize the transition from the initial ramp-up phase to a stabilized, mature operating state for your hotel unit.

Operating under a major brand involves specific financial obligations that impact your store-level margin. The model accurately tracks the 5% royalty fee and 2.5% marketing fund contribution, ensuring you understand the total brand overhead before you ever commit to a franchise disclosure document analysis.

Knowing how to estimate startup costs for a hotel franchise is the first step in securing financing. This franchise startup cost calculator aggregates leasehold improvements, furniture, and equipment costs to determine exactly when your monthly revenue will cover both fixed and variable operating expenses.

We have integrated hospitality industry financial metrics to help you sanity-check your projections against real-world performance. By comparing your labor costs and gross margins to industry standards, you can identify potential margin leaks and refine your hotel operational expense forecasting.


Simply purchase and download the financial model template, then access it instantly using Microsoft Excel or Google Sheets. No installation or technical expertise required-just open and start working.

Enter your business-specific numbers, including revenue projections, costs, and investment details. The pre-built formulas will automatically calculate financial insights, saving you time and effort.

Leverage the investor-ready format to confidently showcase your financial projections to banks, franchise representatives, or investors. Impress stakeholders with clear, data-driven insights and professional reports.

Leverage the investor-ready format to confidently present your projections to banks, franchise representatives, or investors.