


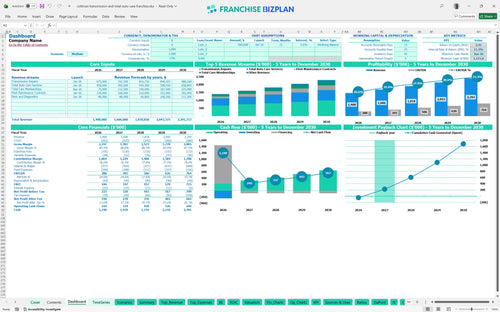
All-in-one Dashboard
Core inputs and core outputs



This auto repair shop financial forecasting spreadsheet includes detailed revenue drivers, staffing plans, capital expenditure schedules, and pro forma financial statements to guide your investment decision.
Core inputs and core outputs
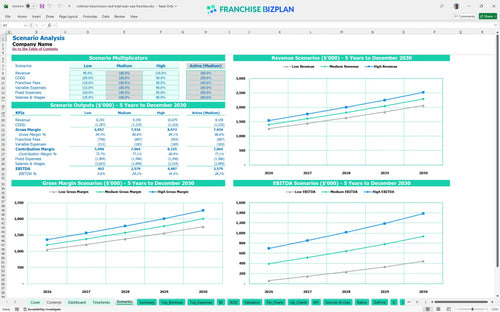
Three scenario analysis
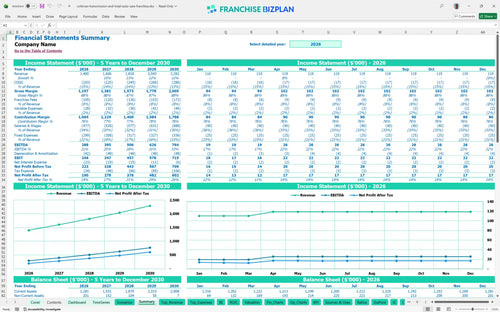
Presentation ready
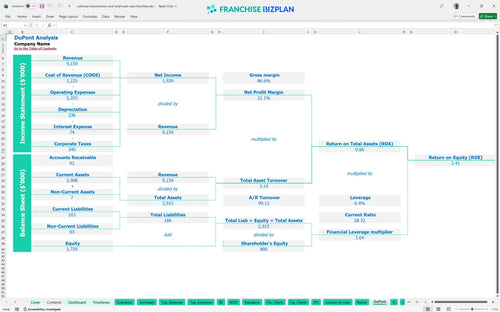
DuPont analysis
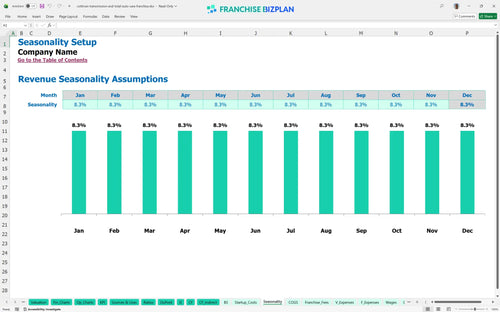
Researched revenue assumptions
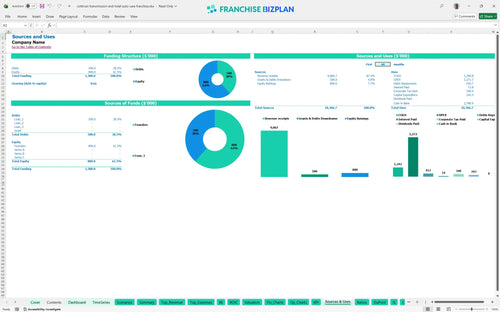
Lender-friendly financial outputs
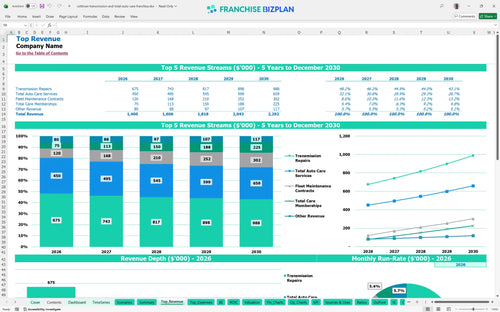
Revenue stream detailed view
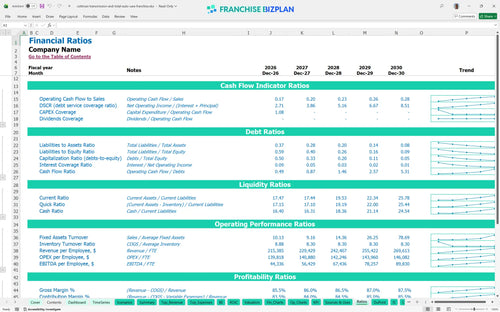
Performance metrics benchmark
We built this franchise unit profitability analysis using deep research into the specialized automotive repair sector. The model includes pre-populated data for $1.4 million in starting revenue and a 7.5% royalty fee, all of which are fully editable to fit your specific territory and local demand.
This unit hits the ground running with a projected EBITDA of $288,000 in its first year of operation. By Year 5, as fleet contracts and memberships scale to over $300,000 and $150,000 respectively, annual EBITDA is expected to reach $764,000 after accounting for all cost of goods and fixed overhead.
To launch this unit in the US, you will need to allocate capital toward a $37,500 franchise fee and significant equipment investments. The total initial outlay includes $90,000 for leasehold improvements and $50,000 for automotive lifts to ensure the facility meets brand standards for specialized repair.
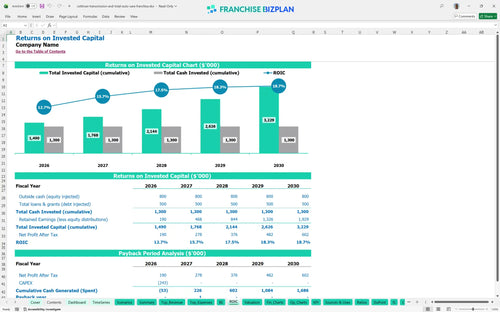
Investors can expect an Internal Rate of Return (IRR) of 11.34% and a Return on Equity (ROE) of 2.41 based on the five-year forecast. The model shows a fast payback period of just 2 years, which is highly efficient for an automotive shop with significant equipment and facility requirements.
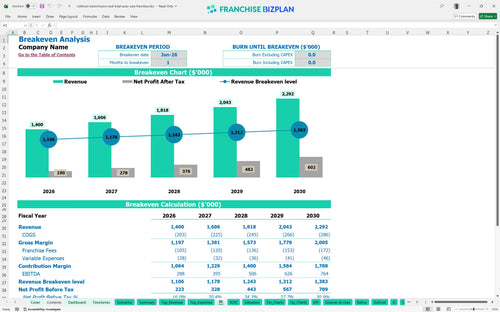
The model indicates a monthly break-even reached in January 2026, which is the first month of trading. This rapid break-even depends on hitting the $1.4 million Year 1 revenue target and managing the $16,500 monthly rent and high-skilled technician salaries effectively from day one.
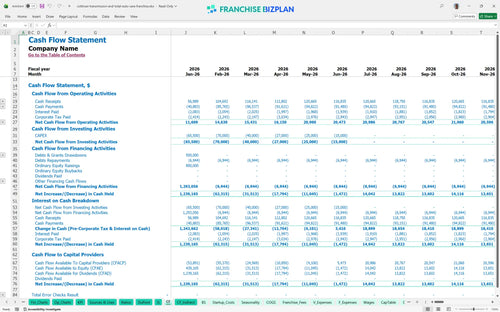
Your lowest cash point is projected at $1,115,000 in June 2026 during the initial ramp-up phase. While the unit shows early profitability, maintaining this cash buffer is critical to handle the timing gaps between parts procurement and receiving payments from B2B fleet partners.
Moving to a High scenario significantly boosts the 11.34% IRR by leveraging fixed costs like the $16,500 monthly rent across higher volume. A Low scenario, where revenue dips below the $1.4 million Year 1 mark, will defintely push the 2-year payback period further out and squeeze the store-level margins.
Finance: update unit break-even and payback model by Friday.
This auto repair franchise financial model is built in Excel to let you swap out assumptions as fast as a transmission fluid change. You can adjust the pre-filled formulas to match your specific shop's footprint, local labor rates, and regional parts pricing to ensure the automotive franchise business plan template reflects your local market reality.

Map out your long-term growth with a full five-year outlook on revenue and cash flow. We track everything from Year 1 sales of $1.4 million to Year 5 projections of $2.29 million, so you can see the compounding effect of fleet contracts and membership growth on your franchise unit performance metrics.

This tool handles the heavy lifting of franchise royalty fee structure calculations by applying the 7.5% rate directly to your gross sales. It accounts for the initial $37,500 entry fee and ongoing brand obligations so you know exactly what stays in your pocket after the franchisor takes their cut before local overhead.

Use our franchise startup cost calculator to estimate the total check you need to write, including $90,000 for leasehold improvements and $50,000 for lifts. The franchise unit break-even analysis calculator shows you the exact sales volume needed to cover your $16,500 monthly rent and high-skilled labor costs.

We have baked in auto service center financial projections based on real-world performance data to help you sanity-check your numbers. Compare your parts margins-starting at 13%-and your labor spend against industry standards to ensure your shop stays competitive while maintaining a healthy store-level margin.


Simply purchase and download the financial model template, then access it instantly using Microsoft Excel or Google Sheets. No installation or technical expertise required-just open and start working.

Enter your business-specific numbers, including revenue projections, costs, and investment details. The pre-built formulas will automatically calculate financial insights, saving you time and effort.

Leverage the investor-ready format to confidently showcase your financial projections to banks, franchise representatives, or investors. Impress stakeholders with clear, data-driven insights and professional reports.

Leverage the investor-ready format to confidently present your projections to banks, franchise representatives, or investors.