
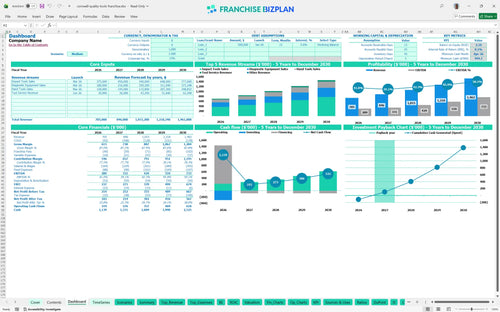
All-in-one Dashboard
Core inputs and core outputs


This comprehensive financial tool provides a complete roadmap for operating a mobile tool distribution territory, covering everything from initial van outfitting to five-year cash flow management.
Core inputs and core outputs
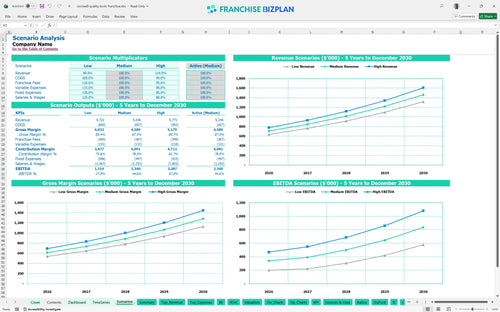
Three scenario analysis
Presentation ready
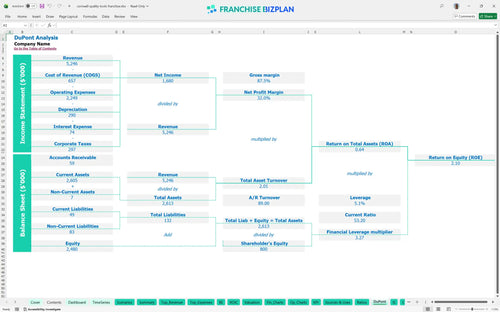
DuPont analysis
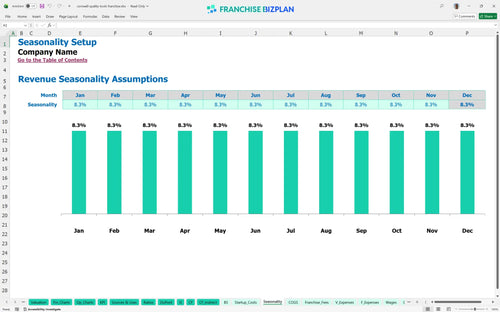
Researched revenue assumptions
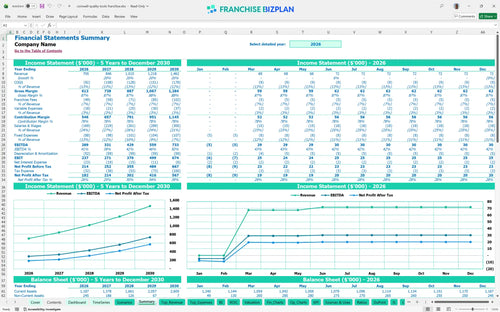
Lender-friendly financial outputs
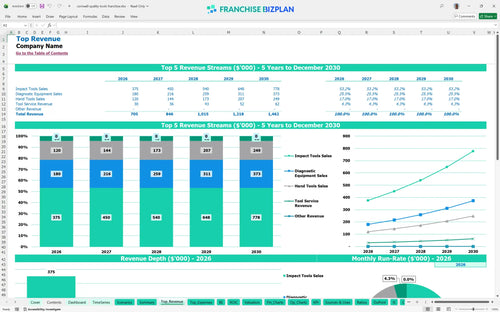
Revenue stream detailed view
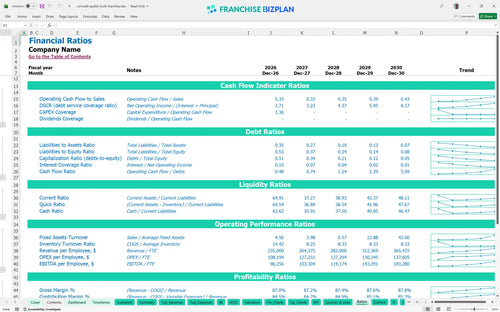
Performance metrics benchmark
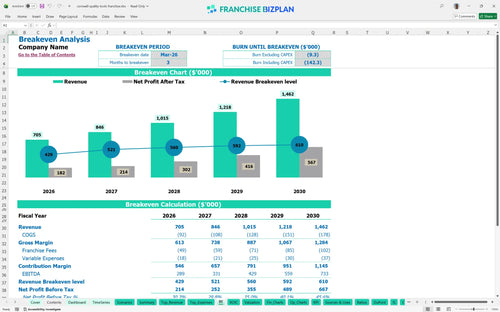
The franchise unit reaches profitability defintely fast, hitting breakeven by March 2026, just three months after launch. With year one EBITDA projected at $289,000, the model accounts for all tool procurement costs, royalties, and the $85,000 owner-operator salary to ensure a healthy bottom line.
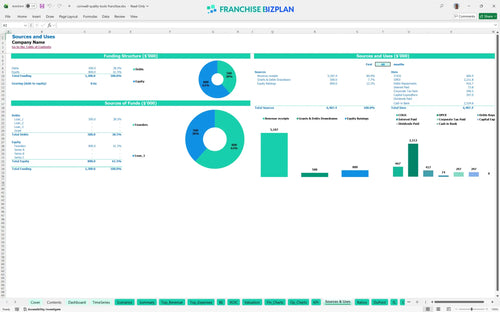
Launching this mobile tool franchise requires significant upfront capital, primarily for the $150,000 custom mobile van and $60,000 in initial inventory. The total investment also covers the $39,000 franchise fee and $25,000 for demonstration equipment to drive on-site sales.
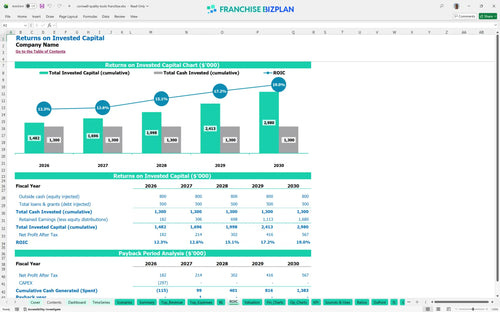
Investors can expect a 2-year payback period on their initial capital, which is strong for the automotive franchise sector. The model shows an Internal Rate of Return (IRR) of 8.13% and a Return on Equity (ROE) of 2.1, reflecting steady recurring revenue from tool financing and service.
The unit hits the monthly break-even point in March 2026, driven by an initial $250,000 in annual impact tool sales. To stay above this line, you must manage the $2,500 monthly van lease and $2,000 in fuel and maintenance costs while maintaining a consistent weekly route.
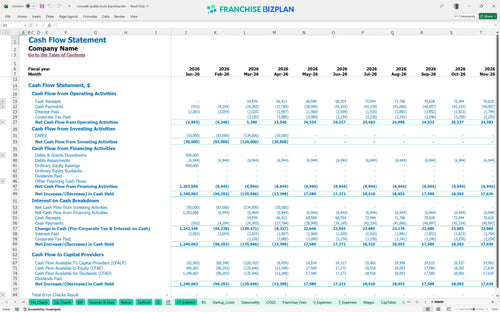
Your lowest cash point occurs in April 2026 at $995,000, suggesting you need a solid liquidity buffer to handle the initial inventory ramp-up. Maintaining this runway is critical because tool service revenue doesn't start until June 2026, creating a slight timing gap in cash inflows.
The difference between the Low and High scenarios hinges on your ability to scale diagnostic equipment sales, which are projected to grow 20% annually. A high-performance scenario pushes year-five revenue to $1.46 million, significantly improving the overall proffitability and shortening the payback window.
Success in this mobile tool franchise depends on route discipline and managing the 12% inventory cost floor. If you can keep the van on the road and the average ticket high, the 2-year payback is highly achievable. Still, you must watch the fuel and maintenance costs closely as they are your largest fixed overhead after the lease.
Finance: update unit break-even and payback model by Friday.
This franchise financial model is built in Excel with fully editable assumptions, allowing you to tweak every driver from route density to tool margins. You can adjust pre-filled formulas to match your specific territory, whether you are focused on high-density industrial hubs or rural repair shops.

Map out your long-term growth with a detailed 5-year outlook that tracks revenue scaling from $705,000 in year one to over $1.46 million by year five. This mobile showroom business model provides a clear view of cash flow and net profit to ensure your multi-unit expansion stays on track.

The model simplifies complex franchise obligations by calculating a 6% royalty and a 1% marketing fund contribution against your gross sales. It accounts for the initial $39,000 franchise fee upfront, so you see the true impact of brand costs on your store-level EBITDA.

Use the franchise startup cost calculator to estimate your total initial investment, which includes the custom mobile van and inventory. The model identifies the exact sales volume needed to cover your $2,500 monthly van lease and other fixed operating expenses.

This tool incorporates automotive franchise investment benchmarks to help you validate your labor costs and inventory procurement percentages. Comparing your projected 12% inventory cost against industry standards ensures your financial projections template for mobile tool business is realistic.


Simply purchase and download the financial model template, then access it instantly using Microsoft Excel or Google Sheets. No installation or technical expertise required-just open and start working.

Enter your business-specific numbers, including revenue projections, costs, and investment details. The pre-built formulas will automatically calculate financial insights, saving you time and effort.

Leverage the investor-ready format to confidently showcase your financial projections to banks, franchise representatives, or investors. Impress stakeholders with clear, data-driven insights and professional reports.

Leverage the investor-ready format to confidently present your projections to banks, franchise representatives, or investors.