
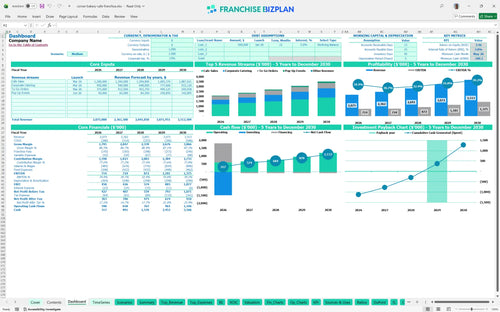
All-in-one Dashboard
Core inputs and core outputs


This franchise unit economics Excel tool provides a complete set of pro forma statements, startup calculators, and multi-revenue stream trackers for a professional food service operation.
Core inputs and core outputs
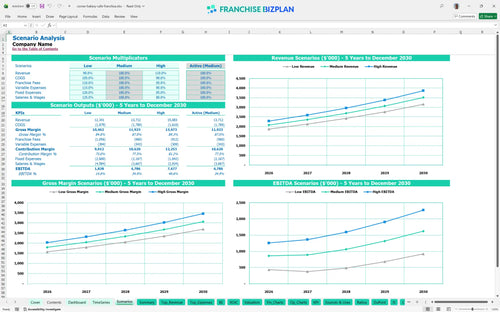
Three scenario analysis
Presentation ready
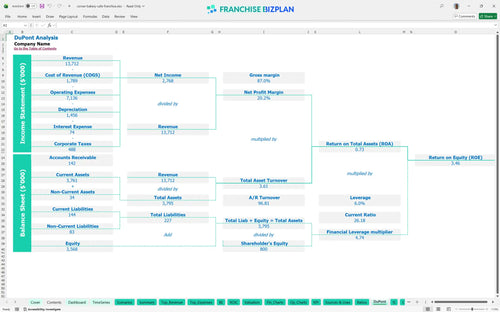
DuPont analysis
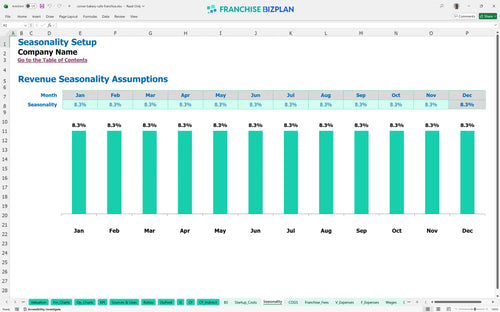
Researched revenue assumptions
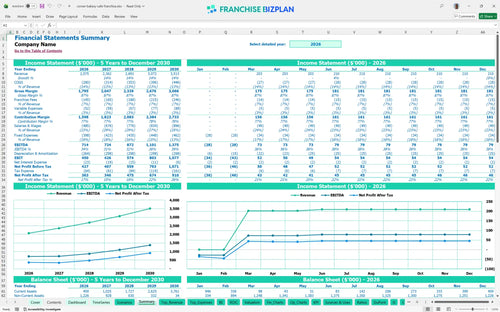
Lender-friendly financial outputs
Revenue stream detailed view
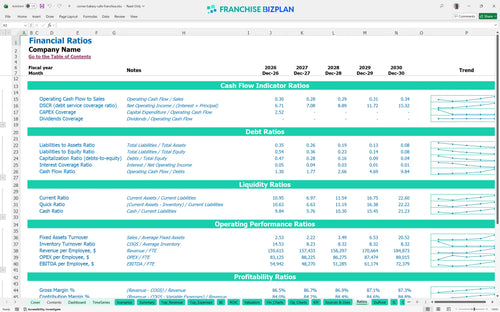
Performance metrics benchmark
We developed this financial model for catering and cafe business operations using extensive research into fast-casual unit economics. The model comes pre-populated with researched data, such as a $2.07 million year-one revenue target and specific labor allocations for bakers and line cooks, all of which are fully editable. It provides the essential financial metrics for new franchise owners to move from a concept to a high-performing retail location.
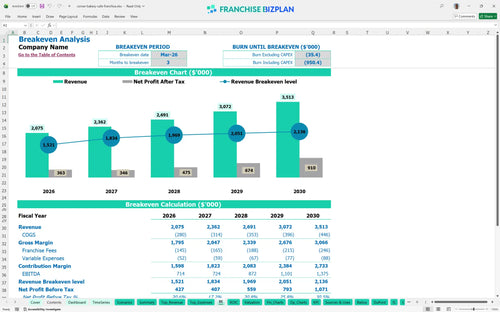
The unit is projected to reach its break-even point calculation by March 2026, just three months after launching. Here's the quick math: by year three, EBITDA is expected to hit $872,000 after accounting for a 12% food cost and all franchise-related fees.
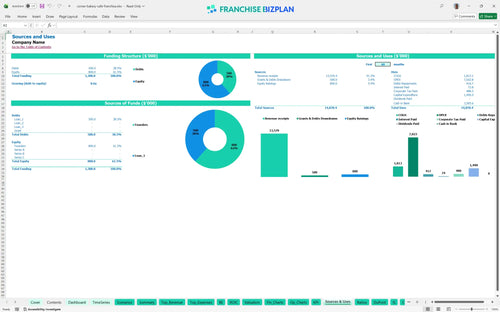
Launching this unit requires a total capital expenditure planning of $1.49 million to cover the build-out and equipment. This includes $600,000 for leasehold improvements and $400,000 for kitchen gear, plus a cash buffer to handle the initial ramp-up phase.
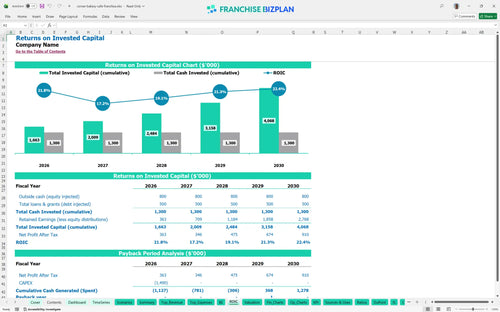
For those evaluating the franchise investment analysis spreadsheet for small business, the model shows an IRR of 3.81% and a 4-year payback period. While the internal rate of return is modest, the cash flow scales significantly, reaching over $1.3 million in EBITDA by year five.
To cover the $25,000 monthly rent and $42,700 in base management salaries, you need to maintain high throughput. The break-even depends heavily on calculating labor and food cost percentages for cafes accurately, as a 1-point shift in food cost changes your monthly cash position fast.
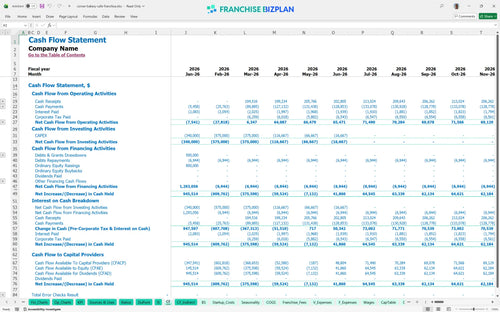
The lowest cash point is projected at -$107,000 in May 2026, meaning you need a solid working capital reserve. This startup financial forecasting for multi-revenue stream franchises suggests having at least six months of fixed costs on hand to navigate the early months of operation safely.
The model allows you to toggle between Low, Medium, and High scenarios to see how a 10% drop in cafe sales affects your cash runway. In the High case, aggressive corporate catering and pop-up events can accelerate your payback period by several months and significantly boost your year-1 margin.
This franchise financial model template is built in Excel to give you total control over your numbers. It features pre-filled formulas and editable assumptions, so you can easily adjust the model for different real estate footprints or local labor markets without breaking the logic. It is the most efficient way to build a restaurant franchise business plan that actually reflects your specific territory.

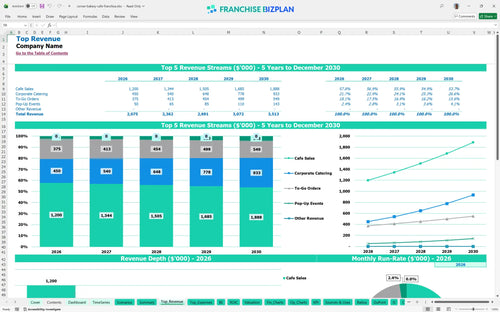
Planning for the long term requires more than just a gut feeling, so we included a detailed 5-year franchise financial projection spreadsheet. You can track revenue growth from $2.07 million in year one up to $3.51 million by year five, allowing for a clear ROI analysis over a standard lease term. This helps you see how scaling to a small franchise chain impacts your bottom-line stability.

We built this model to capture the exact financial obligations of a major food brand, including the 5% royalty and 2% marketing fund contributions. By automating these calculations, you can see the real-world impact of top-line fees on your store-level margin. It defintely simplifies the process of evaluating franchise unit profitability before investing your hard-earned capital.

Understanding how to calculate startup costs for a cafe franchise is the first step to avoiding a cash crunch. This section helps you estimate the total initial investment, including the $40,000 franchise fee and significant leasehold improvements. It maps out your monthly cost structure so you can identify the exact sales volume needed to cover your fixed rent and variable food costs.

This Excel template for fast casual restaurant financial projections includes built-in industry benchmarks to help you sanity-check your operating expense forecast. You can compare your projected labor costs and rent against typical franchise profitability metrics to ensure your plan is realistic. It's a vital tool for preparing a business plan for a retail food franchise that lenders will actually take seriously.


Simply purchase and download the financial model template, then access it instantly using Microsoft Excel or Google Sheets. No installation or technical expertise required-just open and start working.

Enter your business-specific numbers, including revenue projections, costs, and investment details. The pre-built formulas will automatically calculate financial insights, saving you time and effort.

Leverage the investor-ready format to confidently showcase your financial projections to banks, franchise representatives, or investors. Impress stakeholders with clear, data-driven insights and professional reports.

Leverage the investor-ready format to confidently present your projections to banks, franchise representatives, or investors.