
All-in-one Dashboard
Core inputs and core outputs


This franchise unit financial projection template includes a comprehensive Excel-based toolkit with a P&L, cash flow statement, and detailed startup budget template for luxury real estate gallery office planning.
Core inputs and core outputs
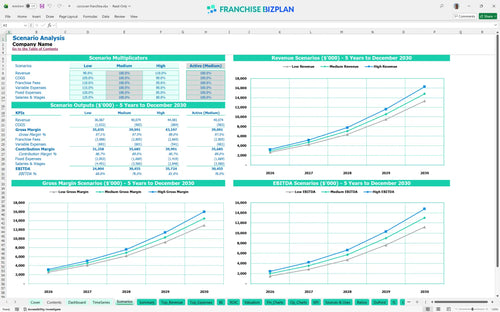
Three scenario analysis
Presentation ready
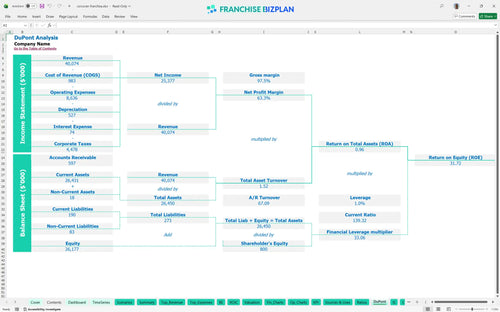
DuPont analysis
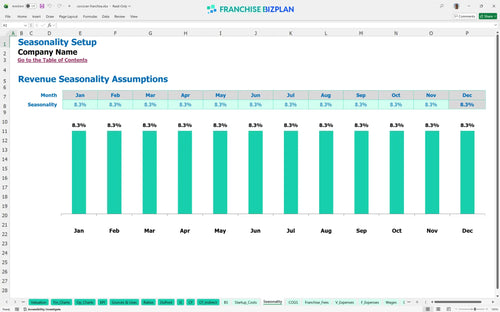
Researched revenue assumptions
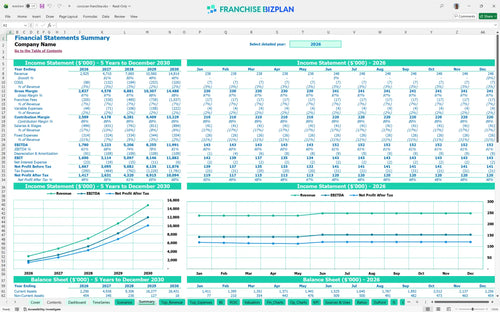
Lender-friendly financial outputs
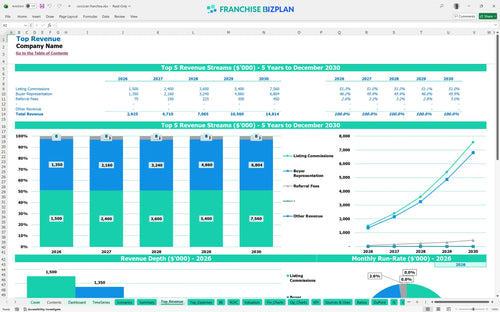
Revenue stream detailed view
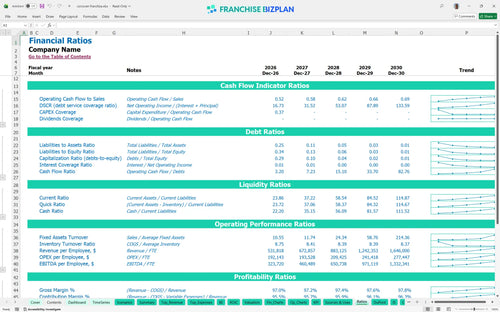
Performance metrics benchmark
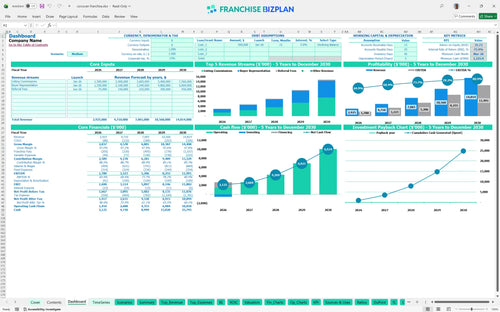
We built this franchise unit financial model using our own research into high-end brokerage economics. Key assumptions, including the 6% royalty fee and $18,000 monthly rent for a premium gallery, are pre-populated with researched data and are fully editable. With a projected Year 1 revenue of $2,925,000 and an IRR of 75.89%, this model provides a data-driven foundation for your investment decision.
The unit reaches profitability almost immediately, with a breakeven date of January 2026. By Year 1, EBITDA is projected at $1.78 million, scaling significantly to $11.99 million by Year 5 as listing commissions and buyer representation fees grow. This trajectory assumes you scale from 2 to 5 advisors to handle the increased volume.
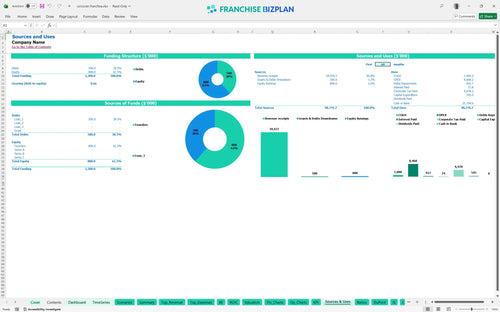
To launch this unit in the US, you need to account for a total initial investment that includes a $25,000 franchise fee and $250,000 for leasehold improvements. The model shows a minimum cash requirement of $1.226 million by March 2026 to cover these startup costs and the initial operating ramp-up.
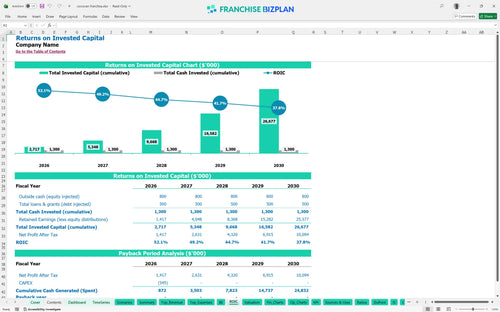
Investors can expect a strong Internal Rate of Return (IRR) of 75.89% and a Return on Equity (ROE) of 31.72%. While the model indicates the full payback period extends after Year 5 due to high initial CAPEX, the annual cash flow becomes very substantial by Year 3.
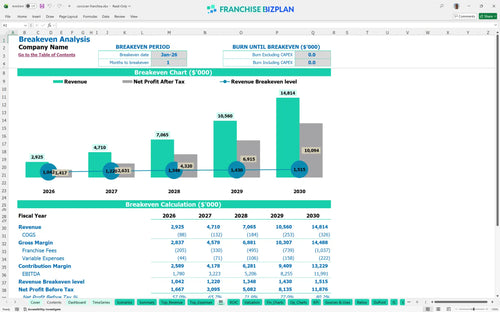
The monthly break-even occurs in the very first month of operation, January 2026. This is driven by the high average ticket on luxury listings, where a single $1M commission target can cover the $18,000 rent and fixed monthly overhead. Managing the 7% total franchise and marketing fees is critical to maintaining this margin.
The lowest cash point occurs in March 2026 at $1.226 million, following the heavy investment in digital displays and furniture. You defintely need to maintain this liquidity buffer to handle the lag between listing a property and receiving the final commission check at closing.
The High scenario assumes listing commissions reach $5.04 million by Year 5, while the Low scenario would see much tighter margins due to the fixed $130,000 Managing Broker salary. A 10% drop in revenue significantly impacts the Year 1 EBITDA of $1.78 million, as fixed costs like the South Congress rent remain constant.
Finance: update unit break-even and payback model by Friday.
This real estate franchise financial model is built in Excel with fully editable assumptions, allowing you to plug in your specific territory data. The pre-filled formulas handle the heavy lifting, so you can focus on adjusting revenue drivers and local operating costs to see how they impact your bottom line. It is a flexible tool designed for both single-unit analysis and multi-unit growth planning.

Planning a luxury real estate franchise business plan requires a long-term view of commission cycles and market ramp-up. This model provides a detailed 5-year outlook, showing revenue growing from $2.9 million in Year 1 to over $14.8 million by Year 5. You get a clear view of how your profit and loss statement evolves as you add advisors and capture more local market share.

The model specifically tracks the royalty fee structure and marketing fund contributions to ensure you understand the net margin after brand obligations. With a 6% royalty and 1% marketing fee, these costs are automatically calculated against your projected commission revenue. This ensures your operating expense forecast accounts for every dollar owed to the franchisor before you calculate your take-home pay.

Launching a high-end gallery requires significant upfront capital, from the $25,000 franchise fee to $250,000 in leasehold improvements. This franchise unit break-even analysis helps you identify the exact month your commission splits cover your $18,000 monthly rent and $27,000+ monthly payroll. You can visualize the total startup investment and the sales volume needed to reach sustainability.

We have included industry-specific benchmarks to help you validate your real estate brokerage startup cost analysis. By comparing your $130,000 Managing Broker salary and $70,000 marketing specialist spend against typical luxury boutique standards, you can ensure your budget is realistic. This helps you sanity-check your annual operating budget template for real estate boutique operations against proven performance ranges.


Simply purchase and download the financial model template, then access it instantly using Microsoft Excel or Google Sheets. No installation or technical expertise required-just open and start working.

Enter your business-specific numbers, including revenue projections, costs, and investment details. The pre-built formulas will automatically calculate financial insights, saving you time and effort.

Leverage the investor-ready format to confidently showcase your financial projections to banks, franchise representatives, or investors. Impress stakeholders with clear, data-driven insights and professional reports.

Leverage the investor-ready format to confidently present your projections to banks, franchise representatives, or investors.