
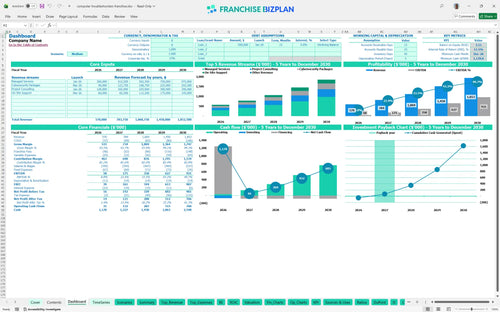
All-in-one Dashboard
Core inputs and core outputs


This excel template for franchise investment feasibility provides a complete roadmap for launching and scaling a tech service location with pre-built logic for recurring revenue and technical staffing.
Core inputs and core outputs
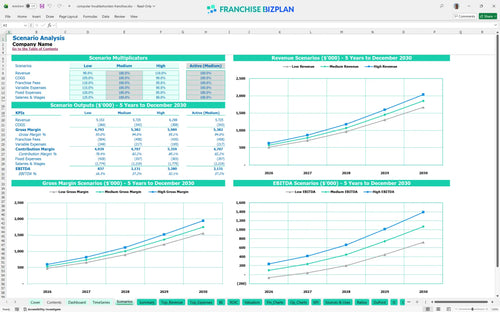
Three scenario analysis
Presentation ready
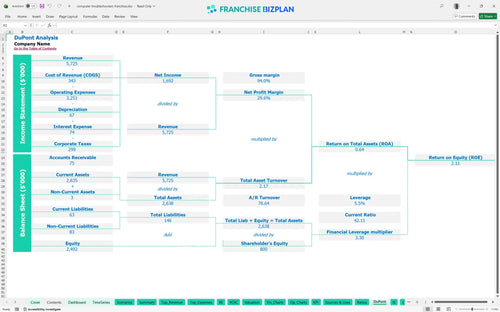
DuPont analysis
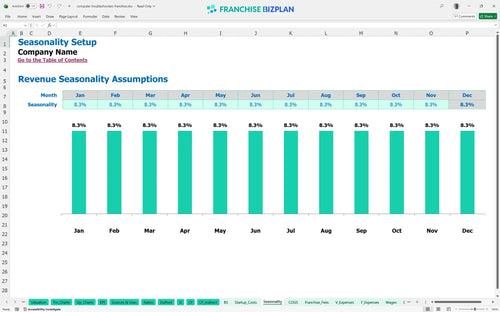
Researched revenue assumptions
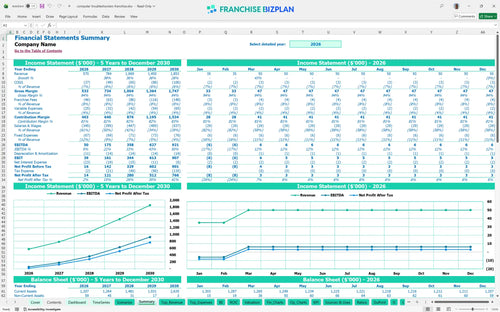
Lender-friendly financial outputs
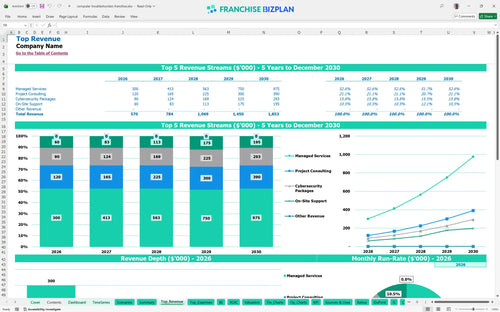
Revenue stream detailed view
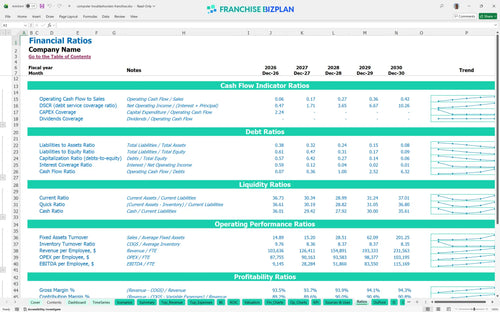
Performance metrics benchmark
We developed this IT franchise unit economic forecasting spreadsheet using detailed research into the managed services sector and specific brand requirements. The model comes pre-populated with data like the $14,900 initial fee and 8% total royalty load, but you can defintely edit every cell to match your specific Tech Ridge territory. With year one EBITDA projected at $50,000, this tool helps you visualize the ramp-up from startup to a mature $1.8M operation.
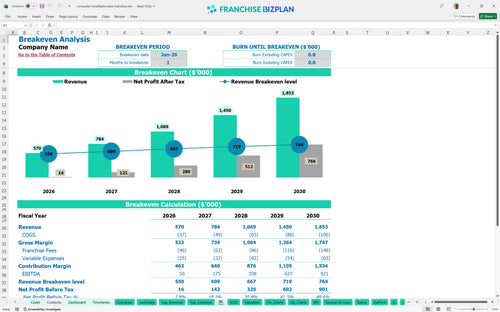
This unit hits a break-even point almost immediately in January 2026, provided you secure initial managed service contracts. Profitability scales significantly by year three, reaching $358,000 in EBITDA as the recurring revenue model compounds and fixed costs like the $3,500 rent become a smaller percentage of total sales.
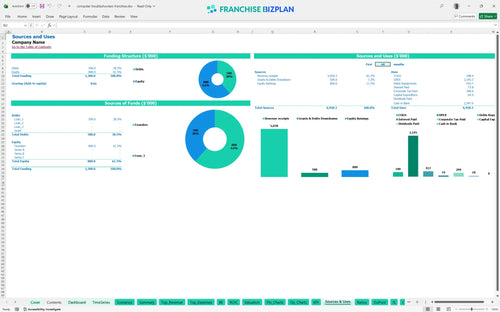
You need approximately $69,900 in hard startup costs plus a working capital buffer to launch this IT franchise in the US. The startup budget spreadsheet for local IT service provider units allocates these funds across the franchise fee, a $15,000 office build-out, and $22,000 in initial networking and workstation hardware.
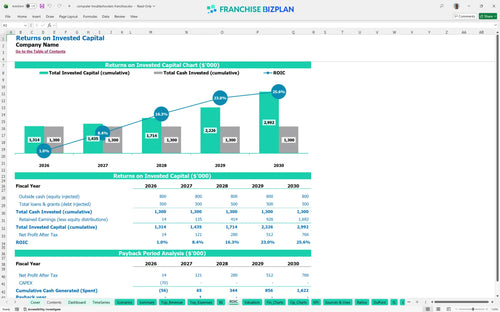
This IT services business valuation shows a 2-year payback period and an Internal Rate of Return (IRR) of 11.47%. While the initial ROE is 2.11, the real value lies in the year 5 EBITDA of $921,000, which creates a high-value exit opportunity for a multi-unit operator.
The break-even analysis for IT consultancy franchise units indicates a very fast path to covering costs, occurring in the first month of operation. This assumes you launch with $200,000 in annualized managed services; the primary risk to this timeline is a delay in hiring the $65,000 senior technician or slower-than-expected client acquisition.
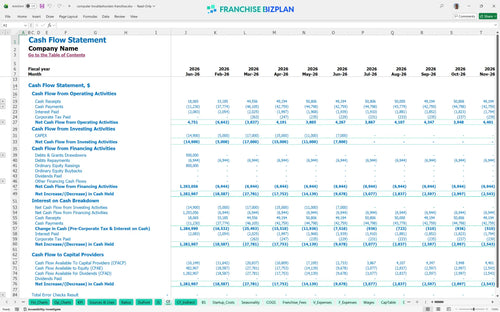
The model identifies a minimum cash point of $1,178,000 in December 2026, which accounts for the significant ramp-up in technical staffing and the timing of project-based consulting payments. You should maintain a cash buffer to handle the $229,000 annual payroll for your initial team of technicians and sales staff.
Projecting profitability for IT support franchise units requires looking at various outcomes; a High case driven by faster cybersecurity package adoption can push year 5 revenue well past the $1.85M baseline. Conversely, a Low case with 20% fewer managed service contracts would extend the payback period and require tighter management of the $50,000 sales consultant commission.
Finance: update unit break-even and payback model by Friday.
This IT franchise financial model is built in Excel with open formulas, allowing you to tweak every assumption from tech salaries to local rent. You can adjust the managed IT services revenue stream or hardware margins to see how local market shifts impact your bottom line instantly.

Planning for a managed service provider business plan requires a long-range view of how recurring contracts stack over time. This model projects five years of growth, showing revenue climbing from $570,000 in year one to over $1.8 million by year five as you scale your client base.

The model tracks the 6% royalty and 2% marketing fund contributions against your gross sales to ensure you see the true net cash flow. It accounts for the initial $14,900 franchise fee and ongoing obligations, helping you manage the franchisor relationship without financial surprises.

Use the franchise startup cost template to map out your initial investment, covering everything from office build-out to diagnostic tools. The break-even analysis for IT consultancy franchise units shows exactly when your monthly recurring revenue covers the $3,500 rent and technical payroll.

We include benchmarks for IT franchise profitability analysis, such as target labor percentages and hardware COGS (cost of goods sold). These help you verify if your $42,000 technician salaries or 4.5% hardware costs align with typical managed service provider standards.


Simply purchase and download the financial model template, then access it instantly using Microsoft Excel or Google Sheets. No installation or technical expertise required-just open and start working.

Enter your business-specific numbers, including revenue projections, costs, and investment details. The pre-built formulas will automatically calculate financial insights, saving you time and effort.

Leverage the investor-ready format to confidently showcase your financial projections to banks, franchise representatives, or investors. Impress stakeholders with clear, data-driven insights and professional reports.

Leverage the investor-ready format to confidently present your projections to banks, franchise representatives, or investors.