


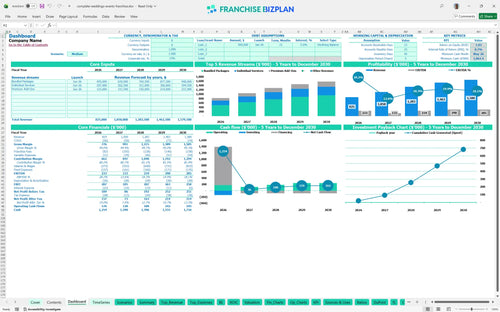
All-in-one Dashboard
Core inputs and core outputs



This comprehensive package includes a dynamic revenue projection spreadsheet for wedding services, detailed labor scheduling, and a full 60-month cash flow projection template.
Core inputs and core outputs
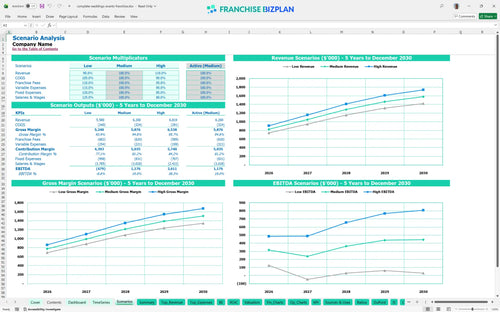
Three scenario analysis
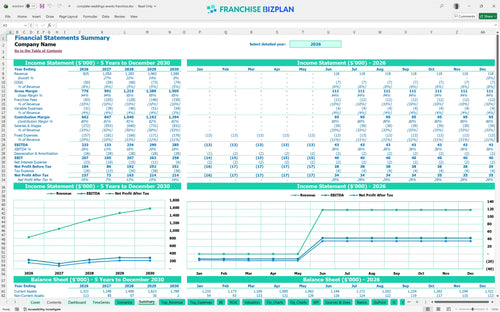
Presentation ready
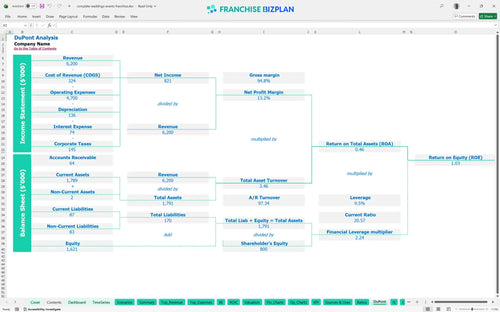
DuPont analysis
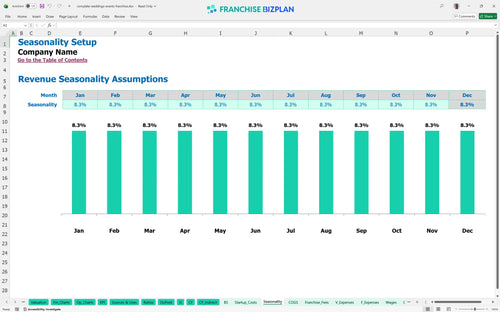
Researched revenue assumptions
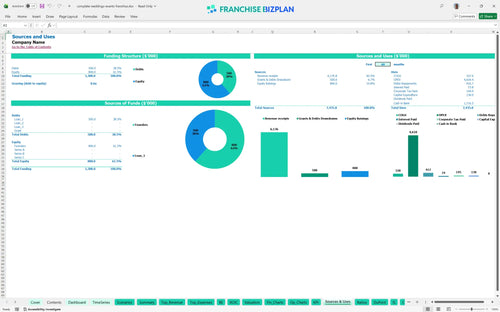
Lender-friendly financial outputs
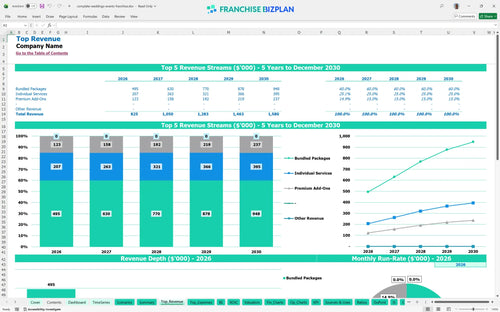
Revenue stream detailed view
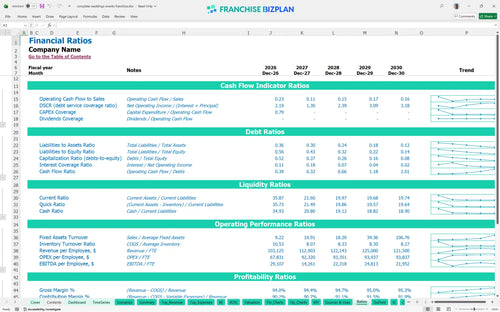
Performance metrics benchmark
We built this wedding event franchise business plan using deep dive research into the multi-service event sector to ensure the data is grounded in reality. Key assumptions like the $825,000 year-one revenue target and the 8% royalty structure are pre-populated but fully editable to fit your local market. This model is a pragmatic guide for estimating profitability for event planning franchise units without the usual fluff. It is a step-by-step franchise business financial model guide for serious operators.
This unit shows positive EBITDA of $233,000 in its first full year, though it dips to $133,000 in year two as you likely scale the team. By year four, the model projects a healthy $290,000 in earnings after all royalties and fixed costs are paid. Still, you have to watch those labor costs closely as your photography and DJ crews expand to meet demand.
Launching this unit in the US requires significant upfront capital, starting with a $50,000 franchise fee and roughly $40,000 in specialized event equipment. Your total initial investment covers everything from studio branding to the initial supplies inventory needed to execute your first 'Experience Night.' Financial planning for premium wedding service providers means accounting for every camera lens and DJ controller before you open.
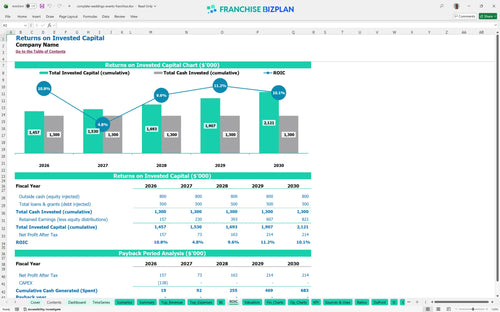
The franchise investment ROI analysis shows an Internal Rate of Return (IRR) of 8.69% and a Return on Equity (ROE) of 1.03. While the model indicates a payback period extending beyond the initial five years, the steady climb in annual revenue to $1.58 million suggests a strong long-term asset. This is a marathon, not a sprint, so focus on the compounding value of your local reputation.
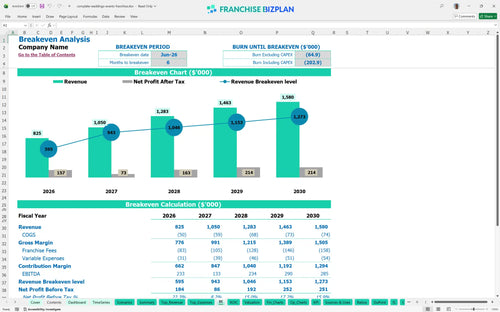
You are projected to reach the break-even point in June 2026, just six months after the initial launch phase. The biggest driver here is your bundled packages, which account for $330,000 in year-one revenue and carry the weight of your $8,500 monthly studio rent. If you can move more couples into these high-value bundles early, you shorten the gap to profitability.
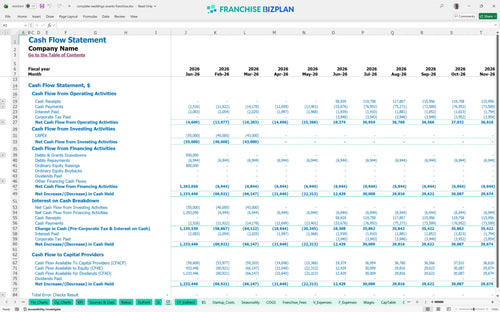
The lowest cash point occurs in May 2026, with a minimum cash balance of $1,062,000 required to navigate the ramp-up. You need enough runway to cover the $11,000 in monthly fixed costs like rent and insurance before the summer wedding season kicks in. Managing your cash flow projection template is vital during these first few months to avoid a liquidity crunch.
The financial model for multi-service event franchises compares a year-one revenue of $825,000 against a year-five high case of $1.58 million. Moving from a medium to a high scenario depends heavily on your ability to scale your photography and DJ crews from 1.5 to 4.0 full-time equivalents. The high case significantly improves your year-over-year EBITDA, but it requires flawless local marketing execution to keep the funnel full.
Finance: update unit break-even and payback model by Friday.
This franchise financial model template is a fully adjustable Excel tool designed for the specific unit economics of a multi-service event business. You can swap out pre-filled formulas and editable assumptions to match your specific territory, whether you are looking at a high-traffic downtown studio or a suburban hub. It defintely simplifies the math so you can focus on booking events instead of fixing broken spreadsheets.

Long-term planning is the difference between a job and a scalable asset, so this model provides a detailed 5-year outlook. You get a clear view of franchise unit financial projections, including revenue climbing from $825,000 in year one to over $1.5 million by year five. It maps out the transition from a hungry startup to a mature, multi-service powerhouse with a full balance sheet view. Every year counts when you are building a legacy.

Franchising has its own set of rules, and this model handles the franchise royalty fee calculation with precision. We have baked in the 8% royalty and 2% marketing fund contributions to show you exactly how much gross profit stays in your pocket. Honestly, seeing these costs alongside your operating expenses is the only way to understand your true store-level margin. No surprises, just clear data on your obligations to the brand.

Knowing how to calculate startup costs for an event franchise is the first step toward signing your lease with confidence. This model breaks down the total initial investment, from the $50,000 franchise fee to the $25,000 for studio leasehold improvements. It helps you identify the exact sales volume needed to hit your break-even point so you can manage your cash runway effectively during the ramp-up phase. Capital expenditure planning is easier when the list is already started for you.

We have integrated built-in benchmarks to help you sanity-check your numbers against typical event industry standards. When you are analyzing franchise unit operational expenses, you need to know if your $8,500 monthly rent or your crew labor costs are in the strike zone. This tool compares your projected performance against gross margin ranges for premium wedding service providers. Use these guardrails to keep your business plan realistic and bank-ready.


Simply purchase and download the financial model template, then access it instantly using Microsoft Excel or Google Sheets. No installation or technical expertise required-just open and start working.

Enter your business-specific numbers, including revenue projections, costs, and investment details. The pre-built formulas will automatically calculate financial insights, saving you time and effort.

Leverage the investor-ready format to confidently showcase your financial projections to banks, franchise representatives, or investors. Impress stakeholders with clear, data-driven insights and professional reports.

Leverage the investor-ready format to confidently present your projections to banks, franchise representatives, or investors.