
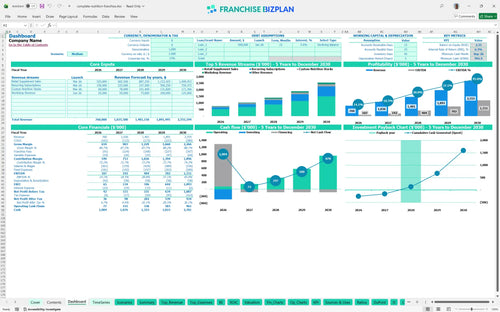
All-in-one Dashboard
Core inputs and core outputs


This comprehensive toolkit includes an Excel financial model template for franchise owners, featuring detailed startup budgets, five-year P&L statements, and automated ROI calculators tailored for the health and wellness sector.
Core inputs and core outputs
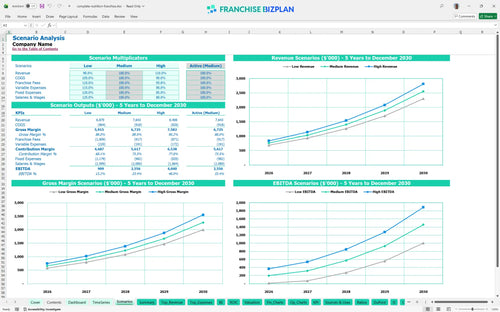
Three scenario analysis
Presentation ready
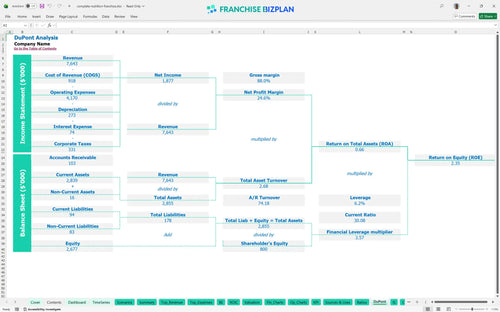
DuPont analysis
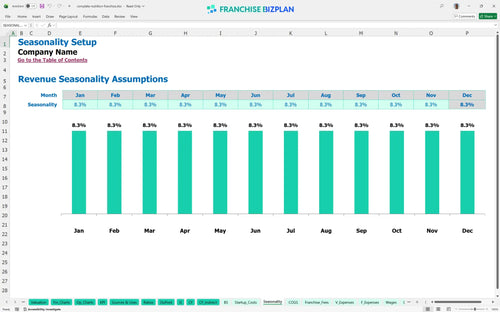
Researched revenue assumptions
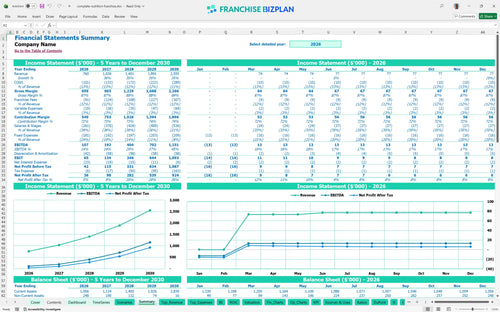
Lender-friendly financial outputs
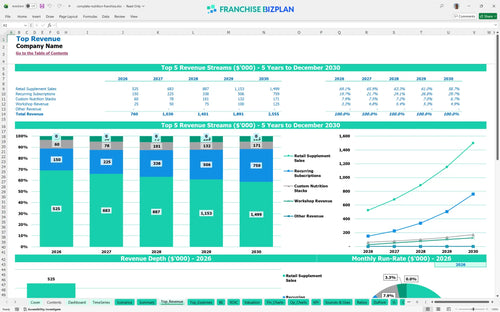
Revenue stream detailed view
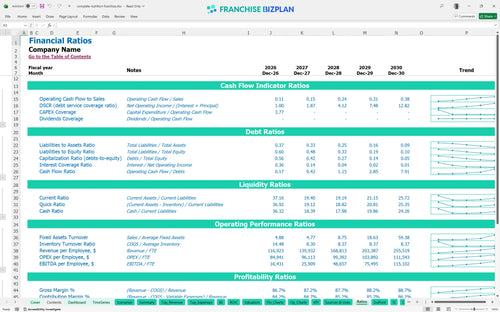
Performance metrics benchmark
We built this franchise unit financial model using deep research into the unit economics of high-end wellness retail. Key assumptions, including the $760,000 year-one revenue target and the 9% royalty structure, are pre-populated and fully editable to match your specific location. This data-driven approach ensures your financial forecasting tools for new franchise units are grounded in reality, not just optimistic guesses.
This unit is projected to reach profitability within its first year, generating $107,000 in EBITDA by the end of year one. You will defintely need to manage the 11.5% inventory cost closely during the ramp-up to ensure net profit stays on track as revenue scales toward the $1.03M mark in year two.
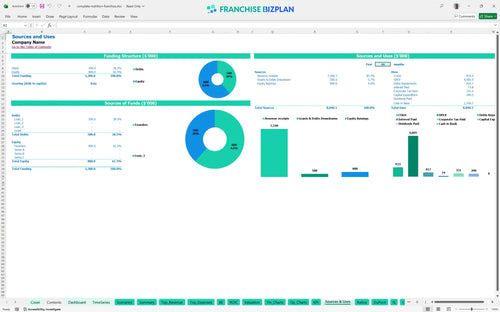
To launch this unit in a high-traffic area like the Domain Northside, you will need approximately $289,500 in total startup capital. This covers the $49,500 franchise fee, $120,000 for leasehold improvements, and $18,000 for medical-grade InBody analyzer equipment, plus an opening cash buffer to handle pre-revenue expenses.
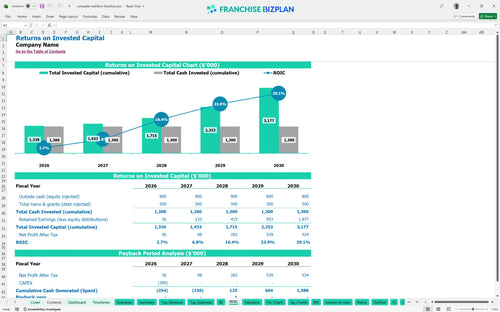
Investors can expect an Internal Rate of Return (IRR) of 6.29% and a Return on Equity (ROE) of 2.35 based on the five-year growth plan. Calculating return on investment for retail nutrition stores shows a payback period of 3 years, which is standard for a build-out heavy retail concept with high recurring revenue potential.
The monthly break-even point occurs in April 2026, just four months after the March launch. The primary driver for this quick turnaround is the high average ticket from retail supplement sales and the $11,000 fixed rent, which requires consistent daily foot traffic and a strong conversion rate from the lead nutritionist.
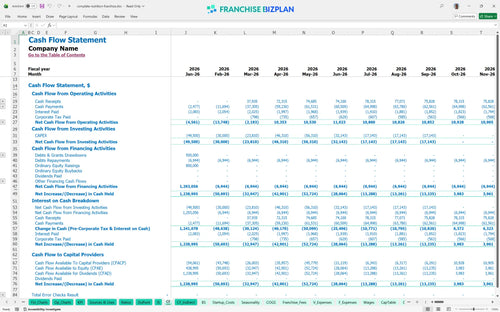
The lowest cash point is projected for September 2026 at $992,000, assuming a significant initial capitalization. You should maintain at least six months of operating liquidity to handle the gap between paying for inventory and realizing revenue from the recurring subscription model, especially during the first year of operations.
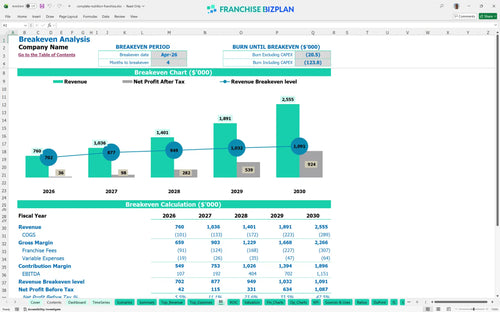
In a High scenario where local marketing execution is flawless, year-5 revenue can climb to $2.55M with an EBITDA of $1.15M. Conversely, a Low scenario with 20% less traffic would delay the payback period by 18 months and significantly increase the peak cash need during the second year of trading.
Success in this model depends on balancing the high fixed occupancy costs of a premium location with the high-margin potential of personalized nutrition stacks and recurring subscriptions. Use this model to stress-test your labor assumptions and ensure your marketing spend is driving enough throughput to clear the break-even hurdle quickly. Still, the numbers only work if you execute the consult-first retail experience at the store level every single day.
Finance: update unit break-even and payback model by Friday
This franchise unit financial model is fully customizable in Excel, featuring pre-filled formulas and editable assumptions that allow you to adapt the math to your specific territory and local market conditions. You can adjust everything from seasonal traffic patterns to local labor rates, ensuring the supplement store financial projections reflect your actual operating environment rather than just a generic estimate.

Planning for a retail franchise business plan requires a multi-year outlook to understand how scaling inventory and staff impacts your bottom line. This model provides detailed 5-year revenue, cost, and cash flow projections, helping you see the transition from the initial ramp-up phase to a mature, high-volume nutrition unit with stable store-level margins.

Operating within a system means accounting for specific financial obligations like the 9% royalty fee and 3% marketing fund contribution. This tool captures these recurring expenses alongside the initial franchise fee, so you can see exactly how much cash stays in the unit and how much goes to the franchisor to support brand-wide growth and local marketing execution.

Our small business startup cost calculator breaks down the total initial investment, from leasehold improvements to the first shipment of supplement inventory. By mapping these upfront costs against your monthly fixed and variable expenses, the model identifies the exact sales volume needed to reach the break-even point analysis and start generating positive cash flow.

To ensure your franchise feasibility study financial template is realistic, we have incorporated industry benchmarks for labor, rent, and cost of goods sold. These built-in guardrails help you sanity-check your assumptions, ensuring your projected 11.5% inventory cost and $11,000 monthly rent align with high-performance retail nutrition standards in premium districts.


Simply purchase and download the financial model template, then access it instantly using Microsoft Excel or Google Sheets. No installation or technical expertise required-just open and start working.

Enter your business-specific numbers, including revenue projections, costs, and investment details. The pre-built formulas will automatically calculate financial insights, saving you time and effort.

Leverage the investor-ready format to confidently showcase your financial projections to banks, franchise representatives, or investors. Impress stakeholders with clear, data-driven insights and professional reports.

Leverage the investor-ready format to confidently present your projections to banks, franchise representatives, or investors.