
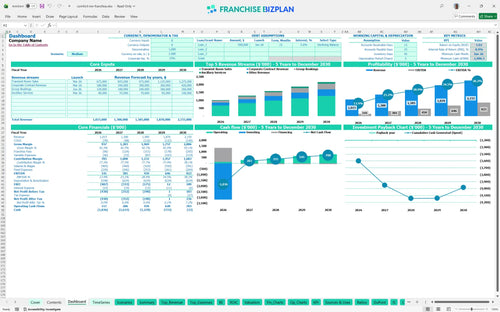
All-in-one Dashboard
Core inputs and core outputs


This franchise unit business plan template provides a complete financial toolkit for estimating startup costs, forecasting multi-year revenue, and managing operational overhead for a new hotel location.
Core inputs and core outputs
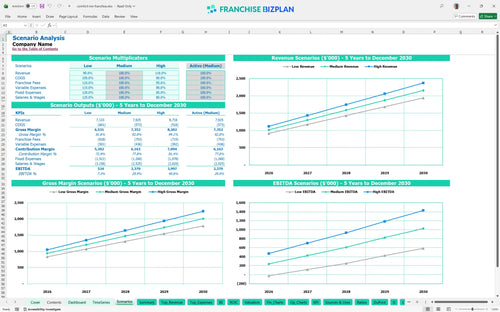
Three scenario analysis
Presentation ready
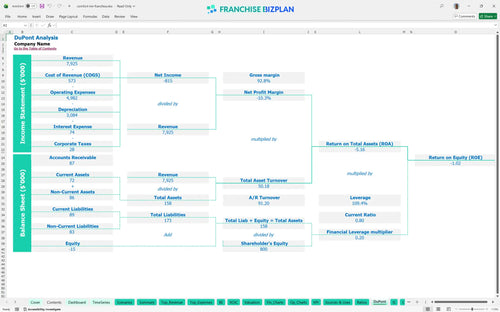
DuPont analysis
Researched revenue assumptions
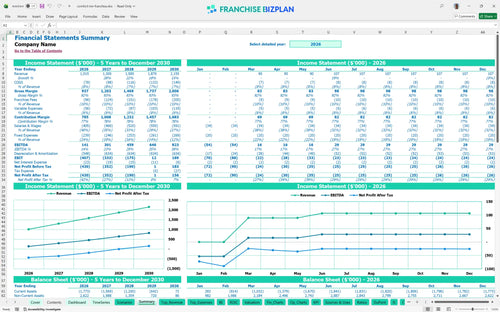
Lender-friendly financial outputs
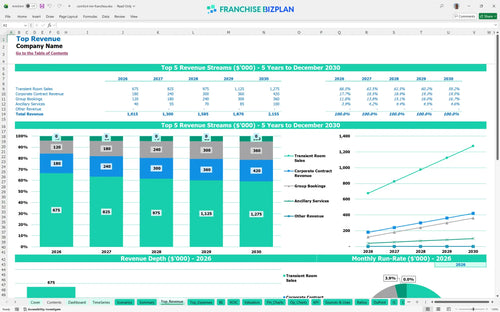
Revenue stream detailed view
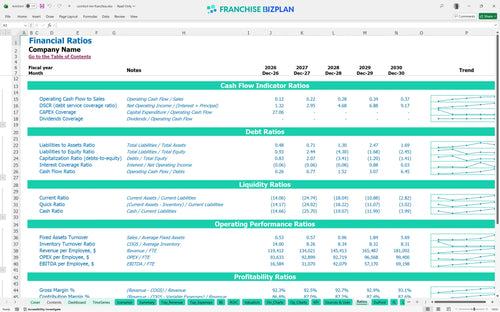
Performance metrics benchmark
We built this franchise unit financial model using our own research to provide a realistic view of hotel ownership. Key assumptions like transient room sales, corporate contracts, and a 6% royalty fee are pre-populated and fully editable. With a projected Year 5 EBITDA of $823,000, this model helps you bridge the gap between a brand brochure and a functional pro forma.
You can expect to hit positive EBITDA quickly, with $141,000 in year one climbing to $823,000 by year five. While the model shows a breakeven date in April 2026, the high initial CAPEX means you are playing a long game for full payback. Here's the quick math: your margin expands as revenue grows from $1.01M to $2.15M while fixed costs stay relatively flat.
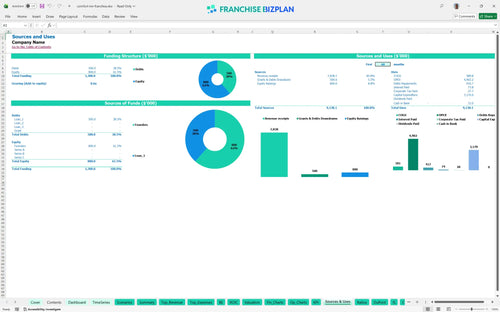
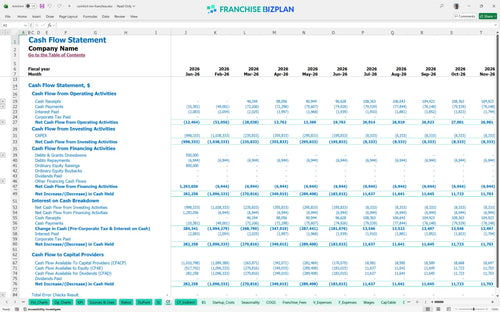
Launching this unit requires significant upfront capital, with leasehold improvements alone costing $1.8M and FF&E adding another $750,000. Your lowest cash point hits roughly -$1.9M in June 2026, so you defintely need a robust financing plan or equity partner. This estimate includes a $100,000 contingency reserve to handle the inevitable surprises during construction.
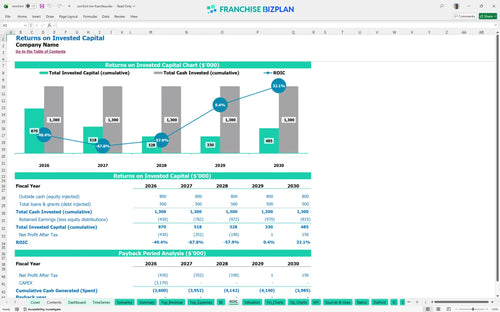
The model shows an IRR of -0.89% and a payback period extending beyond the five-year mark, which is common for heavy-CAPEX hotel projects. While the ROE is -1.02% early on, the value lies in the $823,000 annual EBITDA potential by year five. This is a real estate and brand play where long-term equity building often outweighs short-term cash-on-cash returns.
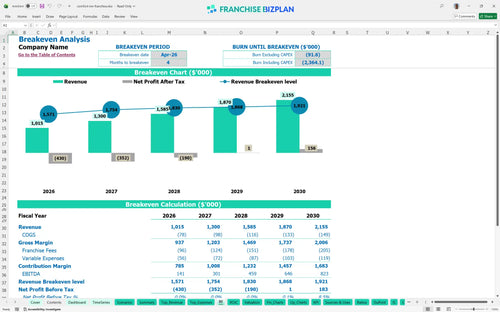
You reach monthly break-even in April 2026, just four months after the March launch. The primary driver here is room volume; you need to fill those beds to cover the $10,000 monthly rent and $20,000+ in fixed payroll. If your ADR (Average Daily Rate) drops by even a few points, that break-even date will slide right.
Your lowest cash point occurs in June 2026 at -$1.9M, right as you ramp up operations. You need enough working capital to survive the gap between paying for $120,000 in shuttle vehicles and seeing the revenue from those guests. We recommend a six-month cash buffer because hospitality is notoriously sensitive to seasonal dips and economic shifts.
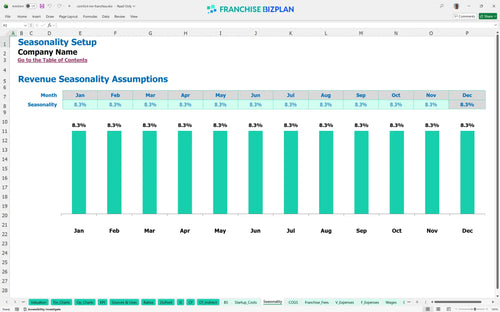
A mid-scale hotel franchise profitability analysis shows that a High scenario beating revenue targets by 10% can pull your payback period forward significantly. Conversely, the Low case might see your peak cash need drop even further, requiring more debt. The model allows you to stress-test ADR and RevPAR to see how sensitive your $823k year-five profit really is.
This hotel franchise financial model is built in Excel, meaning you can tweak every assumption from room rates to shuttle fuel costs. It uses pre-filled formulas so you don't have to be a spreadsheet wizard to see how a small bump in occupancy changes your bottom line. Honestly, a model is only as good as its inputs, so we made every cell editable to match your specific territory and local labor market. Plus, the logic is unlocked so you can add your own custom revenue lines if needed.

Mapping out a five-year horizon is essential for any hospitality franchise investment analysis. This template tracks your growth from an initial $1.01M in year one revenue up to $2.15M by year five as you stabilize operations and build local demand. It provides a clear view of how your balance sheet and cash flow evolve as the unit matures from a startup into a stable asset. Still, you have to watch the ramp-up phase closely to ensure you don't burn through your reserves too fast.

We built in the specific franchise royalty fee structure, including the 6% royalty and 3.5% marketing fund contribution. These fees are calculated automatically against your transient and corporate revenue streams so you see the exact haircut taken before you pay your own bills. It's the best way to understand the real-world cost of brand affiliation and how it impacts your store-level margin. To be fair, these fees buy you access to a massive global reservation system, but they must be modeled accurately.

Use the hotel startup cost calculator to account for everything from the $50,000 initial fee to the $1.8M in leasehold improvements. The model identifies your break-even point-estimated at month 4 here-so you know exactly what volume is required to stop the bleeding. Knowing your fixed vs. variable costs helps you manage the pressure during those first few months of operation. Every dollar spent on pre-opening marketing needs to be tracked against your eventual RevPAR forecasting.

This hotel financial projection template includes benchmarks for labor and occupancy to ensure your numbers aren't pure fantasy. If your housekeeping wages or breakfast costs (starting at 5.2%) drift too far from industry norms, the model helps you spot the outlier. It's like having a CFO whispering in your ear about what's normal for a mid-scale lodging unit. Here's the quick math: if your labor runs 10 points higher than the benchmark, your ROI will vanish regardless of your top-line sales.


Simply purchase and download the financial model template, then access it instantly using Microsoft Excel or Google Sheets. No installation or technical expertise required-just open and start working.

Enter your business-specific numbers, including revenue projections, costs, and investment details. The pre-built formulas will automatically calculate financial insights, saving you time and effort.

Leverage the investor-ready format to confidently showcase your financial projections to banks, franchise representatives, or investors. Impress stakeholders with clear, data-driven insights and professional reports.

Leverage the investor-ready format to confidently present your projections to banks, franchise representatives, or investors.