
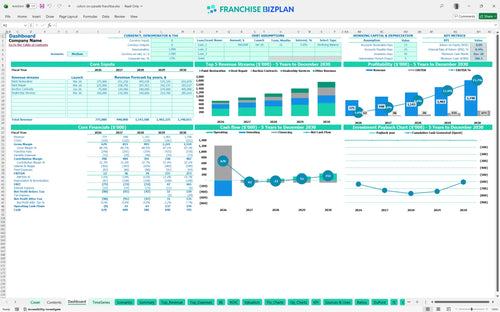
All-in-one Dashboard
Core inputs and core outputs


This Excel template for franchise unit financial forecasting provides a startup budget template for automotive service franchise units, covering everything from CAPEX to multi-year cash flow. A model is only as good as the assumptions you dare to challenge during the planning phase.
Core inputs and core outputs
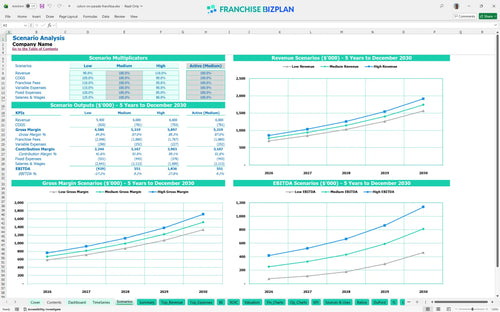
Three scenario analysis
Presentation ready
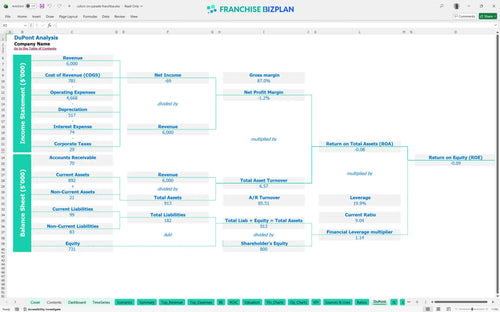
DuPont analysis
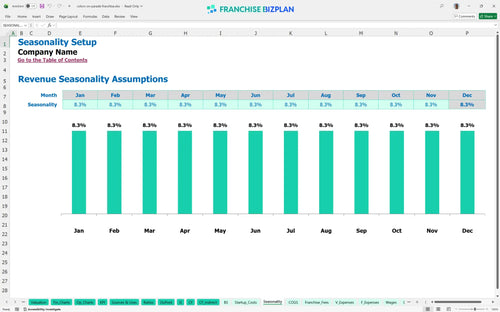
Researched revenue assumptions
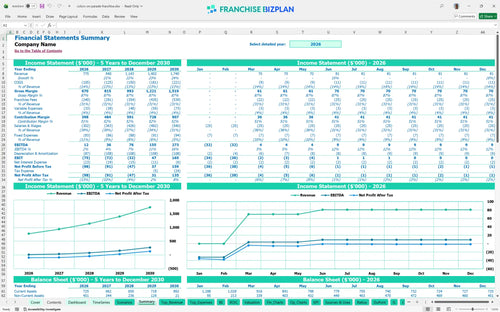
Lender-friendly financial outputs
Revenue stream detailed view
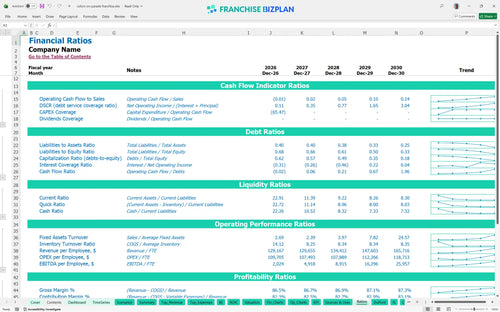
Performance metrics benchmark
We developed this financial model for auto repair franchise investment using detailed research into the mobile reconditioning sector. Key assumptions, including the $775,000 year-one revenue and the 30% royalty structure, are pre-populated but fully editable for your specific location. Here is the quick math: with EBITDA projected to grow from $12,000 to $273,000, managing your technician productivity is the key to real cash flow.
The unit reaches a modest $12,000 EBITDA in year one, but profitability accelerates as you scale auction contracts and dealership services. By year five, the model projects $273,000 in EBITDA, provided you keep paint and materials costs around 10.2% of revenue. Profit is a marathon, not a sprint, in the mobile repair game.
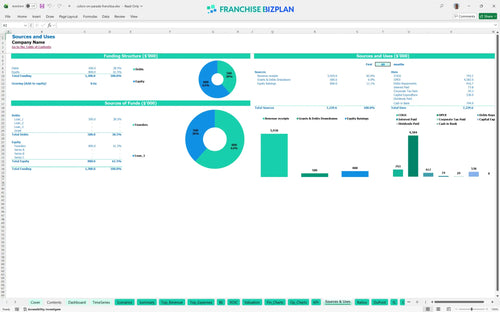
Launching this unit requires approximately $538,000 in total startup capital according to our franchise investment breakdown. This includes $200,000 for mobile service vans, $120,000 for SMART repair equipment, and $75,000 for hub leasehold improvements. You can't drive a business without a clear map of where the initial money goes.
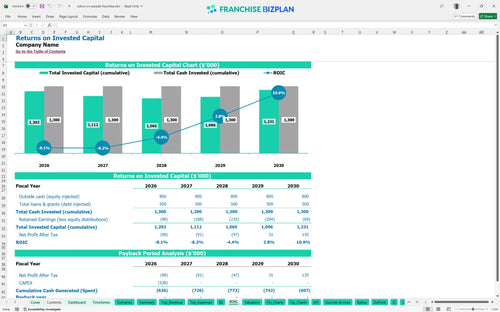
Evaluating franchise ROI for service-based businesses shows an IRR of -0.4% through the first five years, with a full payback occurring after year five. While the annual EBITDA becomes healthy, the high 30% royalty and $538,000 initial CAPEX require a long-term commitment. The real ROI is often hidden in the exit value of a mature multi-van territory.
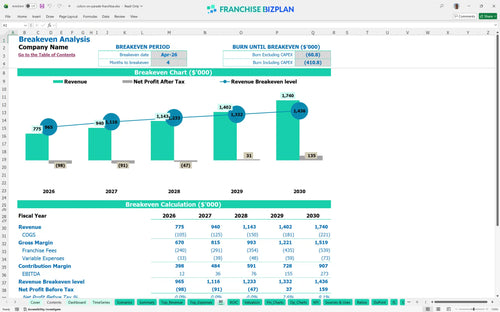
The unit is projected to reach an operational break-even in April 2026, just 4 months after the January launch. To cover $6,950 in monthly fixed costs plus the heavy royalty burden, you must secure your first dealership service contracts by month three. Speed to break-even is the ultimate stress reliever for new franchise owners.
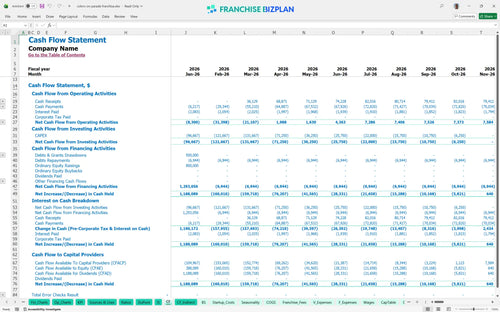
The lowest cash point occurs in December 2028, with a minimum cash balance of $586,000 assuming you have fully funded the startup and reserves. You need to maintain a solid buffer because the high royalty fees and ongoing tool replacements can tighten liquidity during slow months. Cash is the oxygen of your business; don't hold your breath during the ramp-up.
Estimating profitability for mobile reconditioning franchises requires comparing Low, Medium, and High cases to see how a 10% revenue swing impacts your bottom line. In the High case, aggressive local marketing and high technician productivity can significantly shorten the payback period. Planning for the worst makes the best-case scenario much more likely to happen.
Finance: update unit break-even and payback model by Friday.
This franchise financial model template is built in Excel, allowing you to adjust every variable to match your specific territory and market conditions. Whether you are tweaking local labor rates for technicians or adjusting the number of mobile vans in your fleet, the pre-filled formulas handle the complex math automatically. Flexibility is your best friend when local labor rates or fuel prices spike unexpectedly.

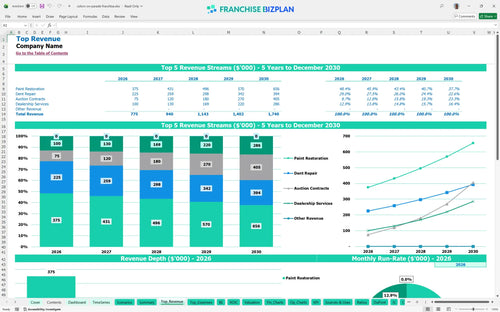
You need to see the long-term trajectory, especially when scaling from an initial $775,000 in year-one revenue to a projected $1.74 million by year five. This automotive franchise business plan provides a detailed franchise unit profit and loss template that maps out your growth path. Revenue is vanity, but five-year cash flow is sanity for any serious operator.

Analyzing franchise royalty and operational costs is critical when the royalty fee is set at a significant 30% of gross sales. This model tracks these ongoing obligations alongside the 1% marketing fund contribution to show you the true net margin remaining for the owner. The franchisor gets paid before you do, so you must watch those royalties like a hawk.

Our franchise startup cost calculator helps you plan the $538,000 initial investment, including the $15,000 franchise fee and $200,000 for mobile service vans. The break-even analysis identifies the exact month your revenue covers fixed costs like the $3,500 hub rent and $1,000 fleet insurance. Knowing your floor is just as important as knowing your ceiling in the first year.

We have integrated realistic benchmarks so you can defintely see if your $65,000 lead technician salary or 11% paint material cost aligns with industry standards. These metrics serve as a vital sanity check for your mobile service franchise financial projections and help identify potential margin leaks. Data beats a gut feeling every single time when you are managing a mobile fleet.


Simply purchase and download the financial model template, then access it instantly using Microsoft Excel or Google Sheets. No installation or technical expertise required-just open and start working.

Enter your business-specific numbers, including revenue projections, costs, and investment details. The pre-built formulas will automatically calculate financial insights, saving you time and effort.

Leverage the investor-ready format to confidently showcase your financial projections to banks, franchise representatives, or investors. Impress stakeholders with clear, data-driven insights and professional reports.

Leverage the investor-ready format to confidently present your projections to banks, franchise representatives, or investors.