
All-in-one Dashboard
Core inputs and core outputs


This franchise unit financial model template provides a complete toolkit for forecasting revenue, expenses, and cash flow for a professional house painting business.
Core inputs and core outputs
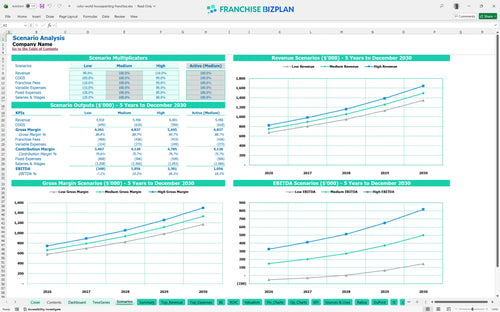
Three scenario analysis
Presentation ready
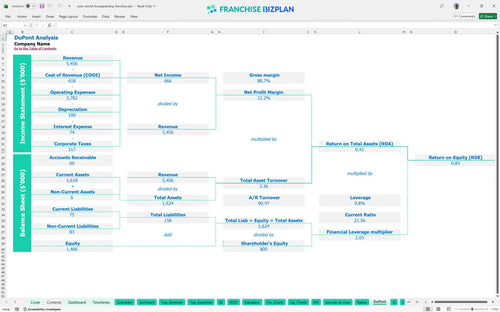
DuPont analysis
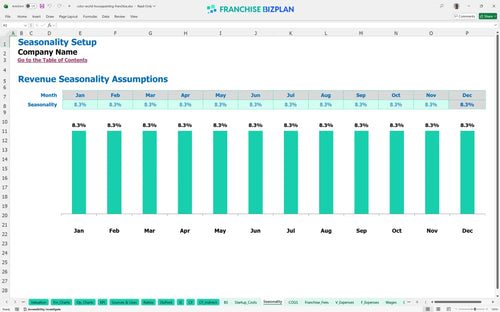
Researched revenue assumptions
Lender-friendly financial outputs
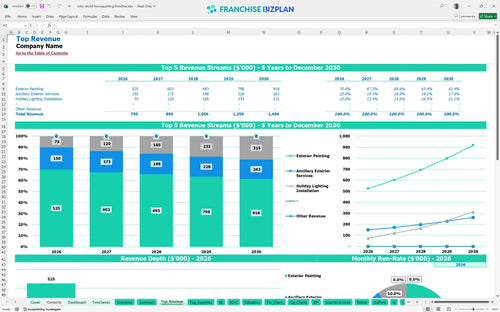
Revenue stream detailed view
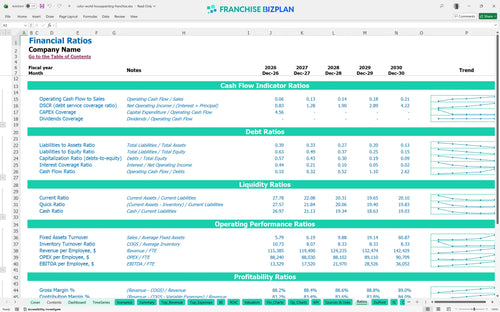
Performance metrics benchmark
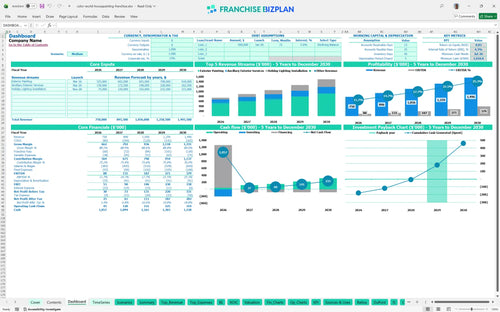
We built this small business financial projection template using detailed research into the home services sector. The assumptions, including the $750,000 year-one revenue target and the $88,000 EBITDA projection, are pre-populated and fully editable to match your specific territory needs.
This franchise unit profitability analysis shows the business reaching an $88,000 EBITDA in year one, which defintely scales as you add crews. By year five, the model projects a net profit jump to $379,000 as operational efficiencies and repeat business take hold. Profitability is a marathon, not a sprint.
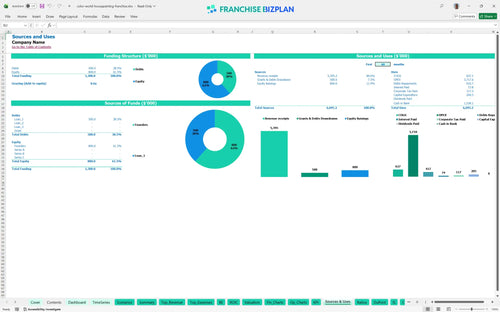
The startup cost breakdown for professional house painting franchises shows a total initial investment focused on equipment and brand entry. Capital expenditure forecasting includes $204,500 in primary setup costs, covering everything from the $49,500 franchise fee to service vehicles. Allocation of capital dictates your early-stage survival.
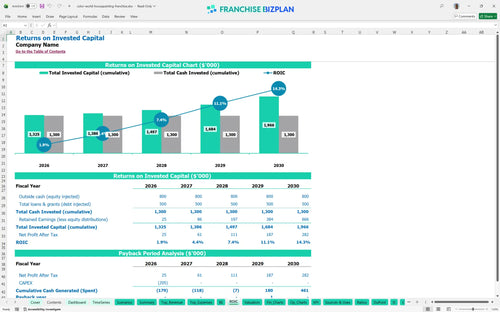
Based on the return on investment calculation, you can expect an IRR of 4.32% and a full payback of your initial capital within 4 years. This Excel template for franchise unit investment analysis helps you visualize the 0.83 return on equity as the business matures. Investors buy cash flows, not just painting services.
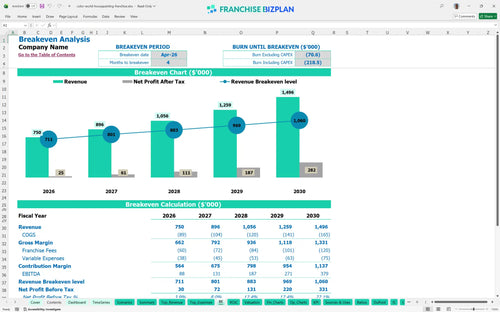
The model estimates revenue for seasonal service franchises needs to hit its stride by month 4, specifically April 2026, to cover all fixed and variable costs. Your break-even is primarily driven by exterior painting volume and the efficiency of your painters and installers. Speed to break-even is your most important early metric.
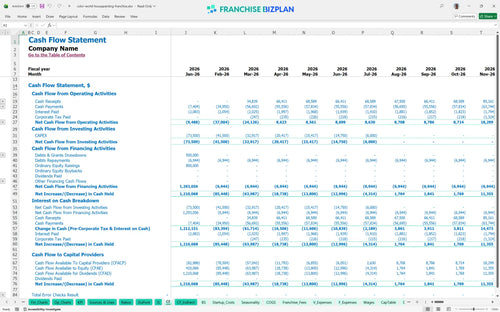
When you forecast cash flow for a local service franchise, you will notice the lowest cash point hits in July 2026 at $1,011,000. This suggests a significant capital buffer is maintained to handle the ramp-up of new crews and equipment. Cash runway is your safety net during the ramp-up.
Evaluating franchise financial performance metrics across different scenarios shows how a 10% shift in revenue can drastically move your year-one margin. The high-case scenario relies on maximizing the $210,000 holiday lighting potential by year five, while the low-case focuses on defensive cost management. Scenarios prepare you for the best and worst of business.
Finance: update unit break-even and payback model by Friday
This franchise financial model template is fully editable in Excel, allowing you to swap out our researched assumptions for your own local data. Whether you are adjusting labor rates or supply costs, the pre-filled formulas handle the heavy lifting so you can focus on the strategy. Customization is the difference between a generic guess and a real plan.

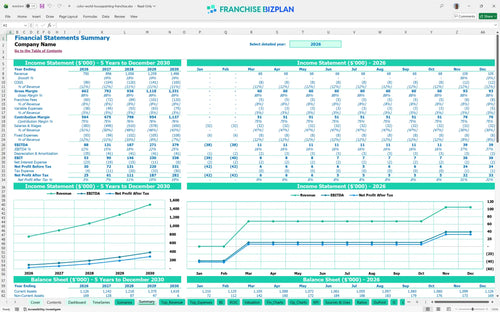
Building a house painting franchise business plan requires a long-term view of how your territory matures over time. This model provides pro forma financial statements for new franchise locations, covering five years of revenue growth from $750,000 in year one to nearly $1.5 million by year five. Five years of data turns a job into a scalable asset.

Our franchise startup costs spreadsheet includes dedicated slots for the 6% royalty and 2% marketing fund fees that impact your bottom line. By tracking these franchise royalty fees against your gross sales, you can see exactly how much cash stays in the business after meeting your brand obligations. Royalties are the price of the brand, so track them to the penny.

Learning how to calculate startup costs for a home service franchise is simpler when you have a structured franchise unit operational budget spreadsheet. This model identifies your fixed and variable costs to determine the exact month you stop burning cash and start generating a surplus. Knowing your break-even number is the only way to sleep at night.

When analyzing profit margins for residential exterior maintenance franchises, you need to know if your 10% paint cost or 30% labor spend is on track. The model includes operating expenses for service franchises based on real-world data, helping you spot margin leaks before they drain your bank account. Benchmarks keep your expectations grounded in reality.


Simply purchase and download the financial model template, then access it instantly using Microsoft Excel or Google Sheets. No installation or technical expertise required-just open and start working.

Enter your business-specific numbers, including revenue projections, costs, and investment details. The pre-built formulas will automatically calculate financial insights, saving you time and effort.

Leverage the investor-ready format to confidently showcase your financial projections to banks, franchise representatives, or investors. Impress stakeholders with clear, data-driven insights and professional reports.

Leverage the investor-ready format to confidently present your projections to banks, franchise representatives, or investors.