
All-in-one Dashboard
Core inputs and core outputs


This financial forecasting tool for new franchise owners provides a ready-to-use franchise unit financial performance dashboard for tracking everything from corporate event revenue to liability insurance.
Core inputs and core outputs
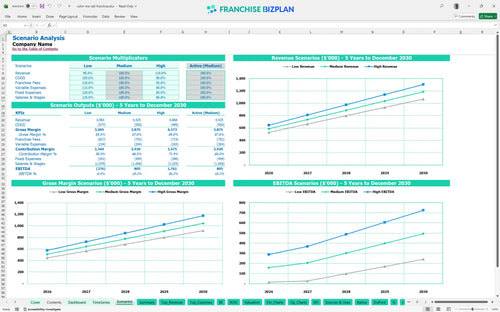
Three scenario analysis
Presentation ready
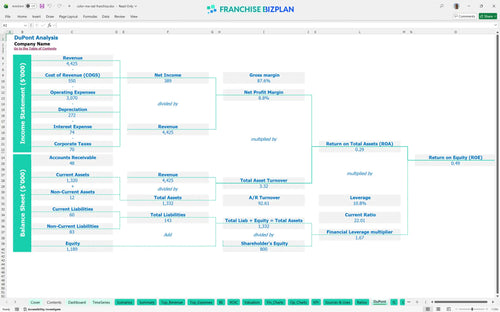
DuPont analysis
Researched revenue assumptions
Lender-friendly financial outputs
Revenue stream detailed view
Performance metrics benchmark
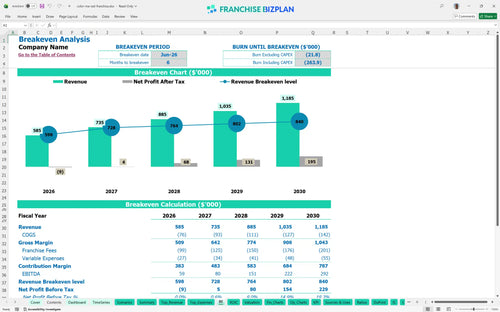
We built this model using our own research into the fitness and color event space to help you understand how to determine franchise profit margins. Key assumptions, including the $150,000 year-one ticket forecast and 15% royalty structure, are pre-populated with researched data specific to this unit and are fully editable. You can see how the June 2026 breakeven date shifts if your corporate event revenue lags behind the $100,000 target.
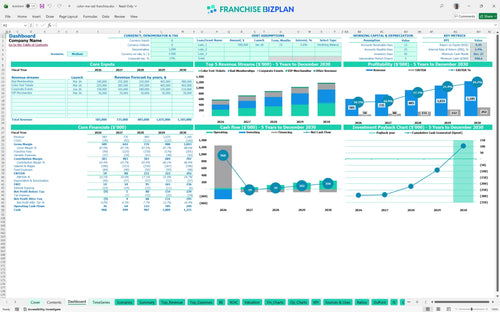
You can expect to hit positive territory by June 2026, just six months after launching your events in the Mueller district. While year one EBITDA starts at $59,000, the model shows this climbing to $292,000 by year five as your membership base matures and fixed costs are spread over higher volume.
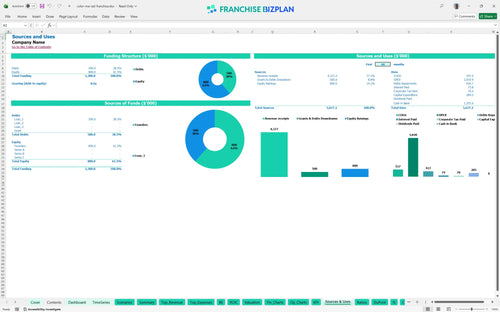
Total initial investment for the build-out and equipment is $284,500, but you will need to account for the $949,000 minimum cash requirement to handle the ramp-up. This is how to calculate startup costs for a fitness franchise while ensuring you have enough runway to cover the $65,000 event manager salary before the first Color Fest.
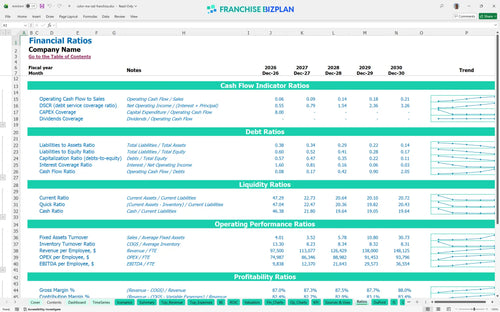
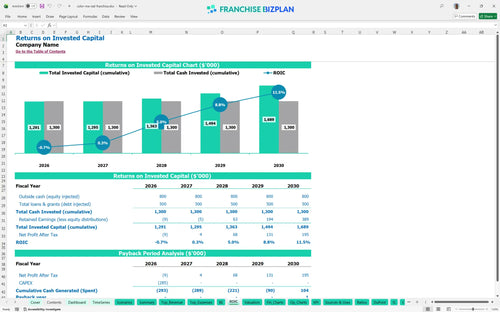
This franchise investment feasibility study template shows a 5-year payback period with an internal rate of return (IRR) of 2.42%. While the ROE is 0.49, the real value lies in the steady climb of annual EBITDA as you dominate the local Austin fitness scene and leverage recurring membership revenue.
You will hit the break-even point in June 2026, roughly 6 months after starting operations. This is the best financial model for recurring revenue franchises because it shows how the 17% combined royalty and marketing burden requires you to hit your $120,000 year-one membership target to cover fixed overhead.
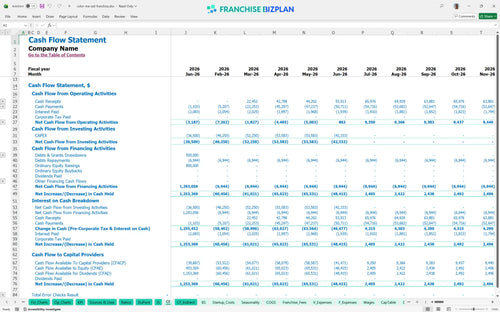
Your lowest cash point hits in December 2027, meaning you need a solid buffer to survive the first two years. Budgeting for local marketing and event production is key, so we recommend keeping the $949,000 cash buffer to manage the timing gaps between venue improvements and mature revenue streams.
Moving from a medium to a high-revenue scenario significantly shifts your year-one margin and speeds up your ROI calculation. If corporate events underperform by 20%, your EBITDA targets for year three will defintely require a tighter lid on marketing and crew payroll to stay on track.
This franchise financial model template lets you swap out every assumption, from ticket prices to local labor rates, without breaking the logic. It is built in Excel so you can defintely adjust the Mueller district venue lease or the number of event crew members as your Austin territory scales. Every formula is open, allowing you to see exactly how your $4,500 monthly rent impacts your store-level margin.

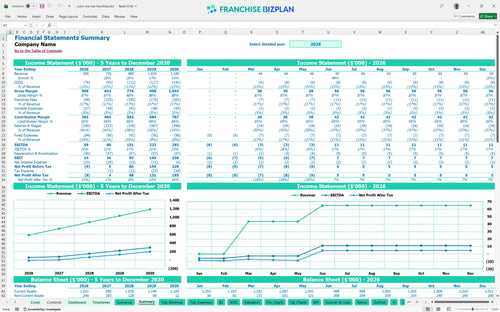
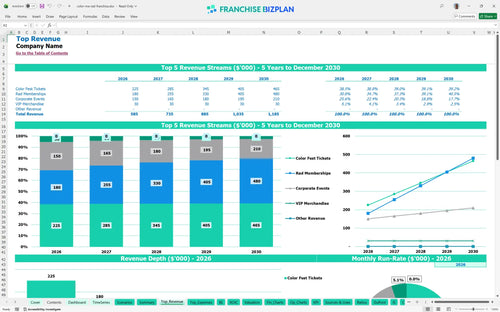
Mapping out a long-term plan is critical when estimating operational costs for event-based franchises, especially since revenue is expected to grow from $585,000 in year one to over $1.1 million by year five. This tool provides a clear view of how scaling from 3 to 5 event crew members impacts your bottom line as you add more themed runs. You get a full picture of the timing gaps between opening costs and mature-unit performance.

High-royalty models demand tight expense management, and this analysis accounts for the 15% royalty and 2% marketing fee right off the top. Knowing that $17,000 of every $100,000 in sales goes to the franchisor before you pay for a single pound of color powder is essential. This helps you price your memberships correctly to protect your unit economics and ensure the local overhead doesn't swallow your cash flow.

Use this franchise startup cost calculator to track the $284,500 needed for venue improvements, photo-op stations, and sound equipment. Analyzing break-even point for a new franchise unit is the first step in managing risk, and this model shows you exactly when your ticket sales will cover your $4,500 monthly rent. If your build-out takes 60 days longer than expected, the model updates your working capital needs instantly.

We have baked in realistic unit economics, like keeping proprietary color powder costs between 8.5% and 9.5% of total sales. Comparing your Austin venue's $4,500 monthly rent against these benchmarks ensures your occupancy costs do not eat your event profits. It is a reality check that prevents you from being too optimistic about labor costs, which often run higher during the initial ramp-up phase.


Simply purchase and download the financial model template, then access it instantly using Microsoft Excel or Google Sheets. No installation or technical expertise required-just open and start working.

Enter your business-specific numbers, including revenue projections, costs, and investment details. The pre-built formulas will automatically calculate financial insights, saving you time and effort.

Leverage the investor-ready format to confidently showcase your financial projections to banks, franchise representatives, or investors. Impress stakeholders with clear, data-driven insights and professional reports.

Leverage the investor-ready format to confidently present your projections to banks, franchise representatives, or investors.