
All-in-one Dashboard
Core inputs and core outputs


This product is a complete financial forecasting template for mobile interior restoration service units, featuring pre-built logic for revenue streams, technician payroll, and franchise-specific fee structures.
Core inputs and core outputs
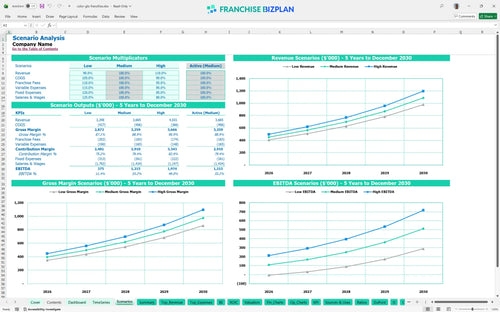
Three scenario analysis
Presentation ready
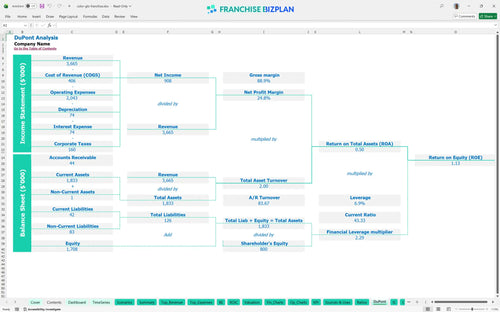
DuPont analysis
Researched revenue assumptions
Lender-friendly financial outputs
Revenue stream detailed view
Performance metrics benchmark
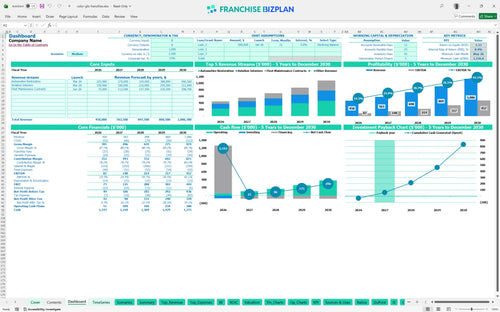
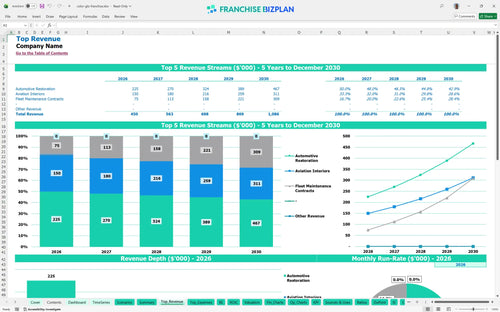
We built this franchise unit financial model using detailed research into mobile restoration unit economics and high-end service standards. The model comes pre-populated with editable assumptions for revenue streams like aviation interiors and fleet contracts, projecting a Year 1 revenue of $450,000 and a 2-year payback period. It is a practical tool designed to help you navigate the specific financial hurdles of a mobile restoration business.
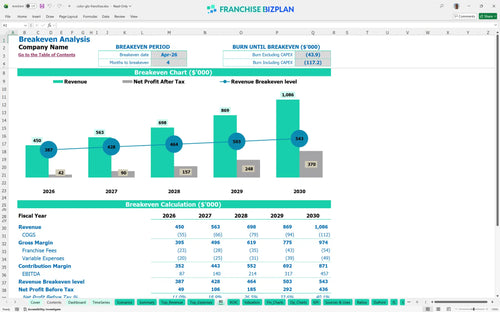
The unit reaches profitability in April 2026, just four months after launching. This business plan financial model for leather and vinyl repair franchise operations shows EBITDA climbing steadily as you secure more recurring fleet maintenance contracts. Speed to profit is the primary goal here.
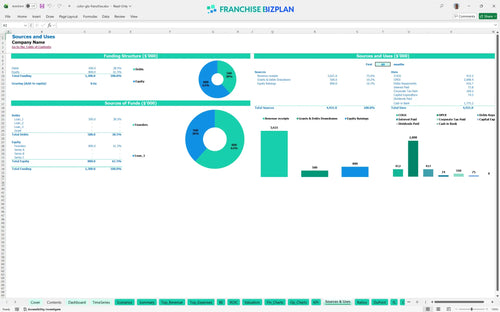
You will need approximately $74,500 to launch, which covers the $40,000 franchise fee and the $18,000 mobile service van fit-out. This startup cost breakdown for automotive restoration franchise units ensures you have the $7,000 in equipment and $4,000 for hub fit-out needed on day one. Capital is the fuel for your first six months.
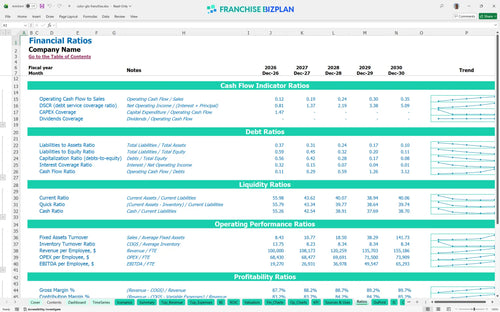
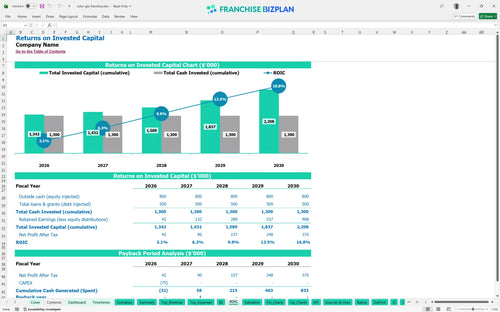
This franchise unit profitability spreadsheet for small business owners estimates an Internal Rate of Return (IRR) of 8.36% and a 2-year payback. By calculating return on investment for franchise unit operations, we see a Return on Equity (ROE) of 1.13, indicating a healthy recovery of your initial capital. Two years to payback is a strong benchmark for mobile services.
You hit break-even in month four, provided you are projecting revenue for mobile aviation interior repair business segments and automotive work totaling about $37,500 per month. The biggest driver is technician productivity, as your $134,000 in Year 1 base salaries represents your largest fixed hurdle. Efficiency is the difference between profit and loss.
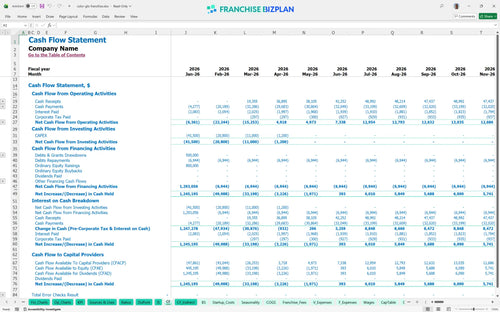
The lowest cash point occurs in May 2026 at $1,157,000, assuming you maintain a significant capital reserve for multi-unit expansion. You defintely need to be diligent about managing operational costs for mobile service franchise units during the first 120 days to protect your liquidity. Cash is king when you are scaling a fleet.
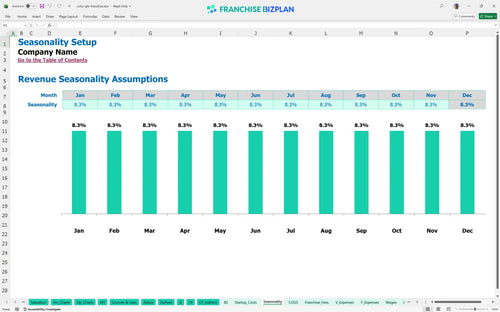
The high-growth scenario pushes Year 5 revenue to $1.086M, while the template for estimating recurring revenue in service franchises shows how fleet contracts stabilize the low-case downside. Even in a medium scenario, the 4% royalty remains manageable as long as your restoration product costs stay near 10%. Scenarios prepare you for the unexpected.
Finance: update unit break-even and payback model by Friday
This franchise financial model template is built in Excel with open formulas, allowing you to adjust every variable for your specific territory. You can easily learn how to create a financial model for a mobile service franchise by tweaking the pre-filled assumptions to match your local market density. It is a flexible mobile restoration business plan tool that handles everything from revenue drivers to local tax rates. One size never fits all in mobile services.

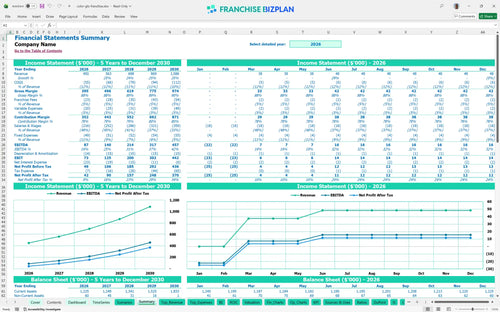
Map your long-term growth with a franchise unit economics model that scales from your first van to a full regional fleet. This interior repair franchise financial projection provides a clear view of your 5-year trajectory, showing how EBITDA grows from $87,000 in Year 1 to $457,000 by Year 5. It is the roadmap you need to see the big picture. Multi-unit success starts with a solid five-year plan.

Managing the 4% royalty and 1% marketing fund contribution is automated within the model to ensure you see your true store-level margin. This level of financial planning for high-end automotive restoration startup operations keeps you ahead of your obligations to the franchisor. It tracks every dollar of recurring franchise profitability metrics so there are no surprises at month-end. Royalties are a reality, so plan for them early.

This franchise startup cost spreadsheet breaks down the initial $74,500 investment, including the $40,000 franchise fee and $18,000 mobile service van. It calculates the exact sales volume needed to cover your $1,800 monthly hub rent and technician wages. Understanding your service-based business valuation starts with knowing your floor. You cannot manage what you do not measure.

We integrated capital expenditure analysis and operational expense management benchmarks to help you sanity-check your restoration product costs, which should trend toward 8.5% of sales. These benchmarks act as a guardrail for your mobile unit, ensuring your labor and supply costs stay within profitable ranges. It is like having a CFO looking over your shoulder. Benchmarks turn guesses into data-driven decisions.


Simply purchase and download the financial model template, then access it instantly using Microsoft Excel or Google Sheets. No installation or technical expertise required-just open and start working.

Enter your business-specific numbers, including revenue projections, costs, and investment details. The pre-built formulas will automatically calculate financial insights, saving you time and effort.

Leverage the investor-ready format to confidently showcase your financial projections to banks, franchise representatives, or investors. Impress stakeholders with clear, data-driven insights and professional reports.

Leverage the investor-ready format to confidently present your projections to banks, franchise representatives, or investors.