
All-in-one Dashboard
Core inputs and core outputs


This Excel template for franchise unit financial projections provides a complete toolkit for forecasting revenue, managing student labor costs, and tracking five-year profitability for a residential service business.
Core inputs and core outputs
Three scenario analysis
Presentation ready
DuPont analysis
Researched revenue assumptions
Lender-friendly financial outputs
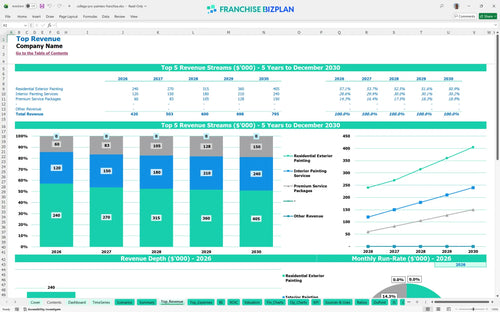
Revenue stream detailed view
Performance metrics benchmark
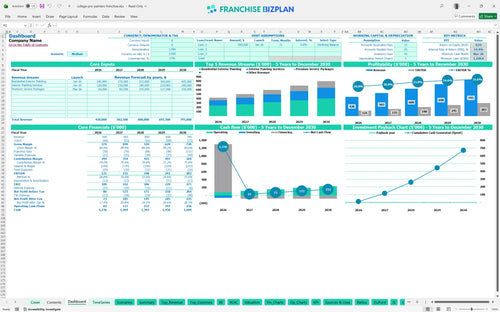
We developed this franchise unit financial model based on detailed research into the residential painting industry and student-led service models. Key assumptions-including the $420,000 year-one revenue target, the 10% royalty fee, and the $63,000 startup cost-are pre-populated and fully editable to fit your specific territory. This tool provides a data-driven look at how a service unit performs from the first marketing launch to a mature five-year operation. It is a pragmatic resource for evaluating franchise investment opportunities in residential services without the fluff.
The unit hits profitability almost immediately, reaching its break-even point in January 2026, just one month after launch. With a year-one EBITDA of $121,000, the model shows a strong trajectory as revenue scales from exterior and interior services. Profitability depends on keeping paint costs at 8% and managing the $55,000 general manager salary against rising job volume. Every dollar saved on supplies goes straight to your bottom line.
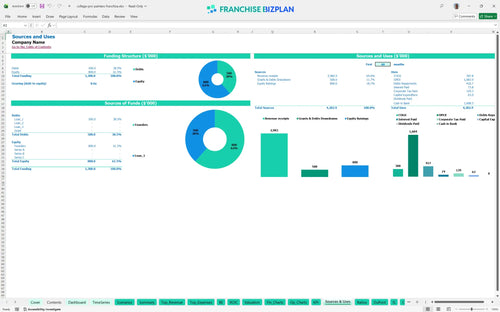
You need $63,000 to launch this unit, covering everything from the initial franchise fee to equipment and marketing. The largest upfront costs are the $25,000 franchise fee and $15,000 for painting equipment inventory. The model also sets aside $10,000 for budgeting for local franchise marketing campaigns to ensure you have a full pipeline of jobs on day one. You defintely need to track these uses of funds to avoid early cash crunches.
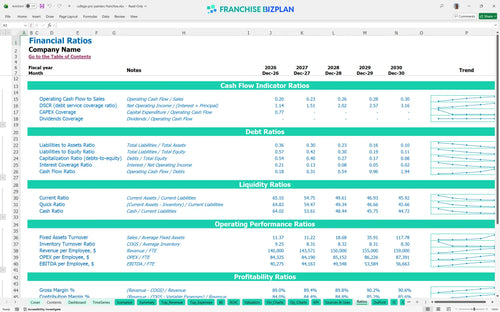
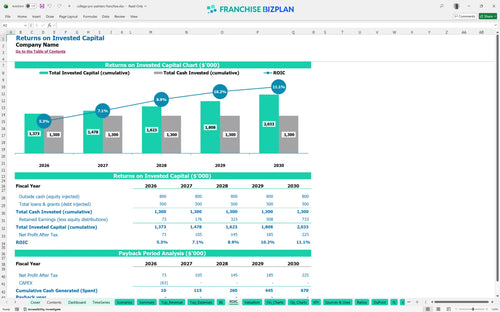
The franchise ROI calculation shows an internal rate of return (IRR) of 14.37% and a return on equity (ROE) of 0.92. While the model indicates the full payback period occurs after year five, the unit generates significant annual cash flow, reaching $283,000 in EBITDA by the fifth year. This suggests a strong long-term yield for operators who can scale their student crews effectively. Cash flow is king, but the exit value is the ace up your sleeve.
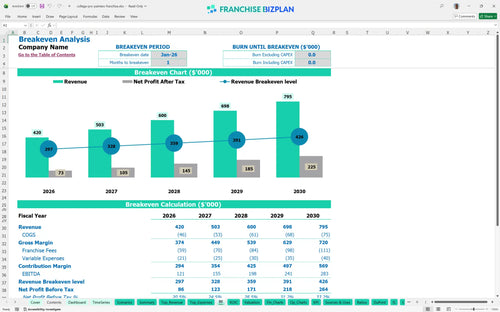
The monthly break-even point is reached in the very first month because the fixed overhead is relatively low at $2,400. The primary driver for staying above break-even is job volume and calculating labor costs for student-run service businesses accurately. If your crew leaders are productive, the 14% combined fee burden is easy to cover; if they stall, your margin disappears. Speed to break-even is the best hedge against risk.
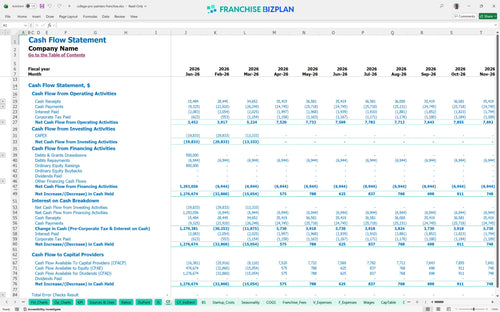
The lowest cash point occurs in March 2026, with a minimum cash balance of $1,229. This tight window happens during the initial ramp-up as you pay for marketing and equipment before the peak spring painting season kicks in. You should maintain a small cash buffer to handle the timing gap between paying your student crews and receiving final payments from homeowners. Cash runway is your oxygen during the first 90 days.
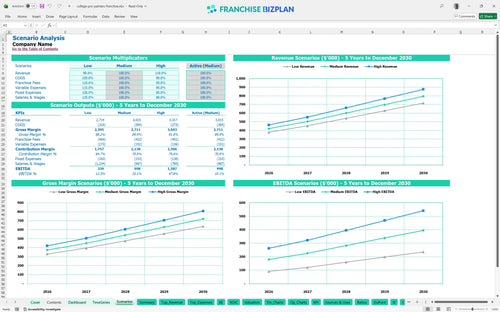
The franchise unit revenue forecasting model allows you to compare Low, Medium, and High scenarios to see how revenue volatility affects your take-home pay. In the High case, revenue hits $795,000 by year five, significantly diluting the impact of fixed costs like the $1,500 monthly rent. In a Low scenario, the $55,000 GM salary becomes a much heavier burden on your year-one margin. Scenarios help you plan for the worst while working for the best.
Finance: update unit break-even and payback model by Friday.
This franchise financial model template is built in Excel with fully editable assumptions, allowing you to tweak every driver from crew size to local material costs. You can easily adjust the residential painting business model to see how changes in job pricing or labor efficiency impact your bottom line. It is a flexible tool designed for operators who need to move beyond static spreadsheets and run real-world numbers. Every cell is open, so you can adapt the math to your specific territory or market conditions. One-size-fits-all models don't work for local service businesses.

Planning for long-term growth requires a clear view of how your unit scales over time, and this franchise unit financial projection provides exactly that. The model tracks revenue climbing from $420,000 in year one to $795,000 by year five, giving you a roadmap for multi-unit expansion or steady single-unit maturity. It includes detailed pro forma statements that help you visualize how EBITDA grows as you move from two to four student crew leaders. This is the essential franchise business plan spreadsheet for any serious operator. Long-term success is about seeing the curve before you drive it.

Managing the franchise royalty fee structure is a critical part of maintaining store-level margins in the home service sector. This model automatically calculates the 10% royalty and 4% marketing fund contributions based on your monthly sales forecasts, so there are no surprises at month-end. It also accounts for the $25,000 initial fee and ongoing scholarship fund contributions, ensuring your cash flow reflects the true cost of the brand. This is a vital financial planning guide for new franchise owners who need to see net profit after all corporate obligations. Royalties are a fixed reality, so you have to out-manage them.

Knowing how to estimate startup costs for a painting franchise is the first step toward a successful launch. This model aggregates the $63,000 total initial investment, including $15,000 for equipment and $10,000 for the marketing launch, to show you exactly what is at risk. The integrated break-even analysis for home service franchises identifies the exact revenue volume needed to cover your $2,400 in monthly fixed costs. It helps you understand the gap between your first job and your first dollar of true profit. You can't manage what you don't measure from day one.

This model incorporates financial metrics for measuring franchise unit performance based on actual residential painting data. It includes benchmarks for paint and supplies, which should stay around 8% of revenue, and equipment maintenance at roughly 3%. By using these pre-filled standards, you can perform a realistic profitability analysis for residential service franchises and see where your unit might be leaking margin. It acts as a sanity check for your local operating assumptions. Benchmarks tell you if your performance is elite or just average.


Simply purchase and download the financial model template, then access it instantly using Microsoft Excel or Google Sheets. No installation or technical expertise required-just open and start working.

Enter your business-specific numbers, including revenue projections, costs, and investment details. The pre-built formulas will automatically calculate financial insights, saving you time and effort.

Leverage the investor-ready format to confidently showcase your financial projections to banks, franchise representatives, or investors. Impress stakeholders with clear, data-driven insights and professional reports.

Leverage the investor-ready format to confidently present your projections to banks, franchise representatives, or investors.