
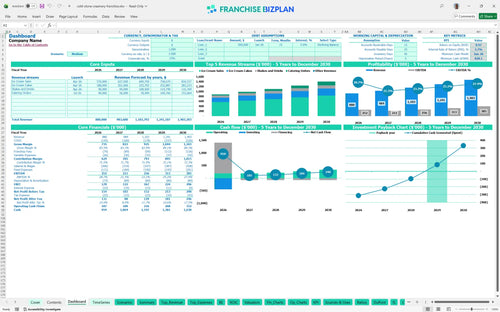
All-in-one Dashboard
Core inputs and core outputs


This ice cream franchise financial model excel template provides a professional-grade analysis of startup costs, five-year cash flows, and unit-level profitability for serious operators.
Core inputs and core outputs
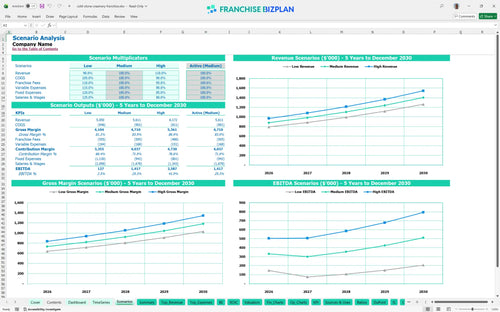
Three scenario analysis
Presentation ready
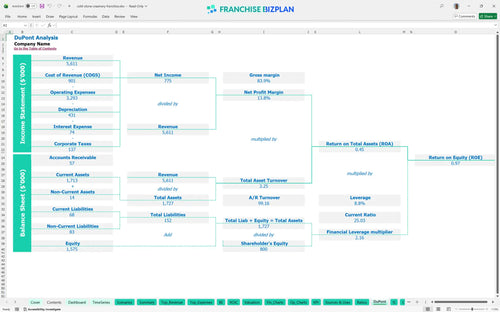
DuPont analysis
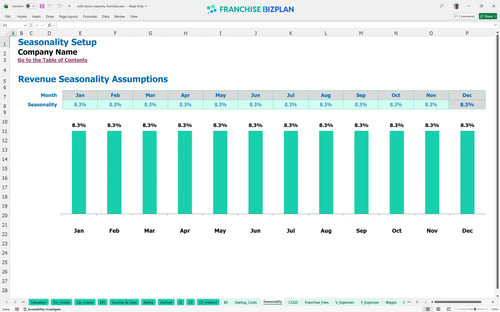
Researched revenue assumptions
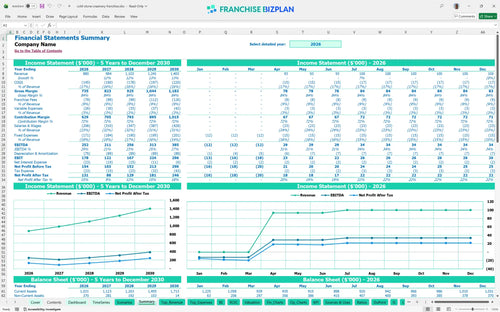
Lender-friendly financial outputs
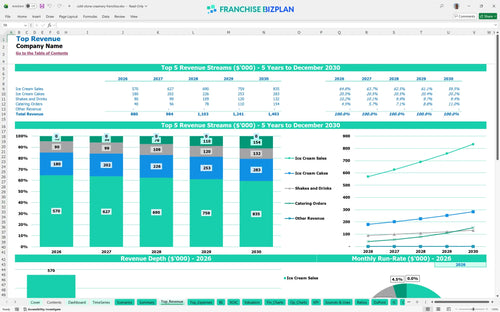
Revenue stream detailed view
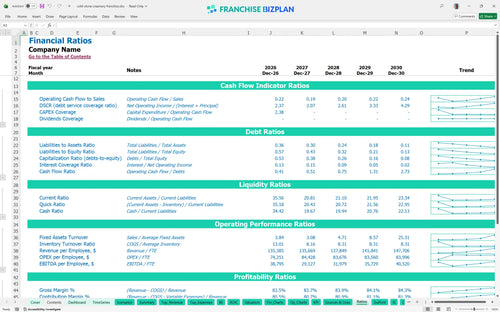
Performance metrics benchmark
We built this franchise unit financial model based on deep research into the dessert and frozen treat sector. The assumptions for revenue streams like ice cream cakes and catering, along with expenses like the $11,000 monthly rent and 9% combined royalty/marketing fees, are pre-populated and ready for your input. Here is the quick math: with year one EBITDA at $252,000, the model shows a clear path to operational health if you manage the $60,000 manager salary and crew costs effectively.
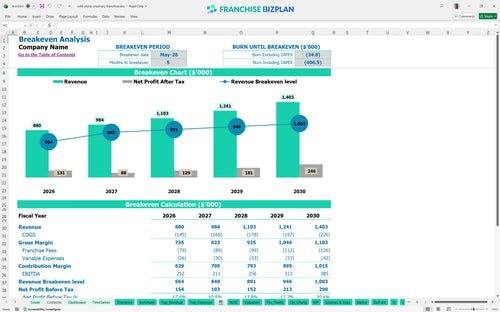
Your unit hits the break-even point in May 2026, just five months after the initial investment phase. While year one shows a strong $252,000 EBITDA, true net profitability after accounting for the full $445,000 in startup CAPEX and debt service usually stabilizes as you ramp up catering and cake sales. Still, the model shows you are cash-flow positive almost immediately due to high average tickets and theatrical service value.
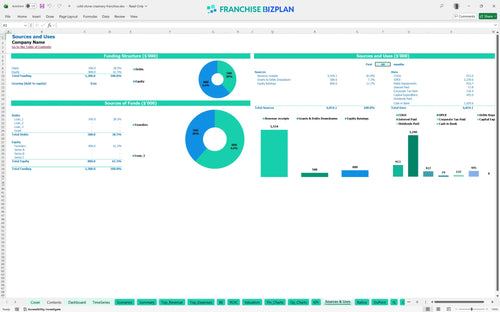
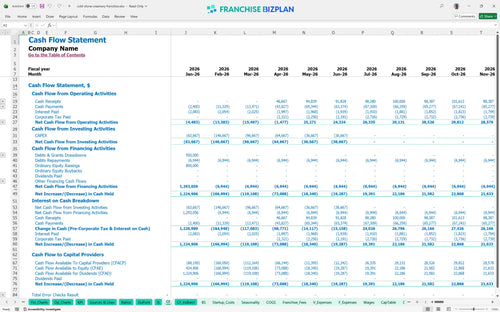
You will need approximately $445,000 to get the doors open, covering everything from the $27,000 franchise fee to the $220,000 leasehold build-out. The model also accounts for $65,000 in display cases and $45,000 for the signature frozen granite stones. Honestly, the biggest variable is the leasehold improvement, so having a $828,000 minimum cash position as shown in June 2026 provides a safe buffer for any construction delays.
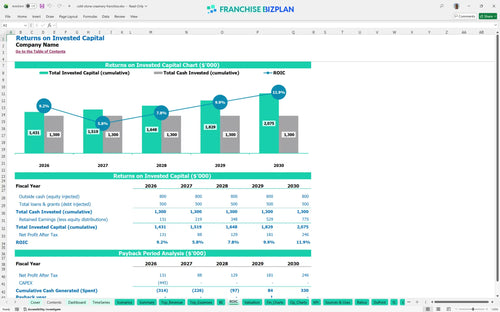
The franchise investment return shows an Internal Rate of Return (IRR) of 3.74% and a Return on Equity (ROE) of 0.97 over the five-year period. You are looking at a payback period of 4 years to recoup your initial capital. While the IRR might look modest, the steady climb in EBITDA to $385,000 by year five suggests a very stable, long-term cash-flowing asset once the initial debt is cleared.
The unit reaches break-even in month 5, which is May 2026. The main driver for this is the high fixed cost of $11,000 for prime location rent and the $14,250 monthly payroll for the manager, assistant, and crew. To hit this faster, you need to focus on throughput during peak evening hours when the 'theatrical' preparation draws the biggest crowds from the nearby pedestrian corridors.
The lowest cash point occurs in June 2026 at $828,000, which includes your operating buffer and initial working capital. This is the 'danger zone' where pre-opening costs have been paid but the catering revenue stream ($40,000 starting in July) hasn't fully kicked in yet. Managing your opening inventory and delaying non-essential furniture fixtures can help protect this runway during the first 90 days of trading.
In the High scenario, reaching $1.4 million in revenue by year five significantly boosts your store-level margin as fixed costs like the $11,000 rent become a smaller percentage of sales. The Low scenario, however, shows that if revenue stays flat at $880,000, the 9% royalty and marketing burden plus high labor costs will tighten your cash runway. The model allows you to toggle these variables to see how a 10% drop in traffic affects your ability to service debt.
This franchise financial model is built in Excel to give you total control over your unit's future. You can swap out the pre-filled assumptions for your specific territory, adjust the pricing for local demand, and see how different staffing levels impact your bottom line. It is a flexible tool designed to handle the messy reality of retail franchise financial projections without breaking the formulas.

Planning for a single scoop is easy, but planning for a five-year horizon requires a deeper look at franchise unit economics. This model tracks your growth from an initial $880,000 in year one to a projected $1,403,000 by year five. It maps out your revenue, costs, and cash flow so you can see exactly when the business matures and how the store-level margin evolves as you scale.

The model specifically tracks the royalty fee structure and brand obligations that eat into your monthly take-home. With a 6% royalty and a 3% marketing fund contribution, $79,200 of your first year's $880,000 revenue goes straight to the franchisor. We built this to ensure you defintely account for these off-the-top costs before you even think about paying your rent or staff.

Knowing how to calculate franchise startup costs is the difference between a successful launch and a mid-build-out cash crisis. This tool aggregates your $27,000 franchise fee, $220,000 in leasehold improvements, and $110,000 for specialized freezers and stones to find your total nut. It then calculates the exact monthly volume you need to stop burning cash and start seeing black ink.

We have integrated retail franchise financial projections with real-world benchmarks to keep your planning grounded. If your dairy ingredients (COGS) are hitting 14% or your rent is $11,000 a month, the model helps you see how those numbers stack up against industry norms. It is a sanity check that ensures your ice cream shop business plan isn't just a best-case scenario but a realistic operating map.


Simply purchase and download the financial model template, then access it instantly using Microsoft Excel or Google Sheets. No installation or technical expertise required-just open and start working.

Enter your business-specific numbers, including revenue projections, costs, and investment details. The pre-built formulas will automatically calculate financial insights, saving you time and effort.

Leverage the investor-ready format to confidently showcase your financial projections to banks, franchise representatives, or investors. Impress stakeholders with clear, data-driven insights and professional reports.

Leverage the investor-ready format to confidently present your projections to banks, franchise representatives, or investors.