
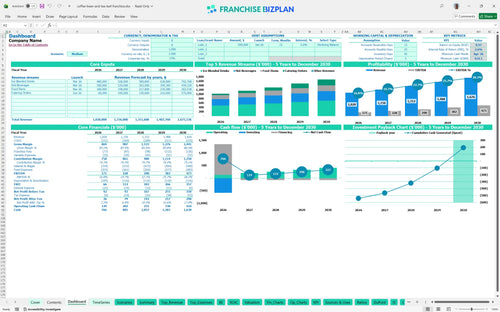
All-in-one Dashboard
Core inputs and core outputs


This comprehensive financial model provides a detailed roadmap for managing startup budgets, operating expenses, and long-term profitability for a specialty beverage unit.
Core inputs and core outputs
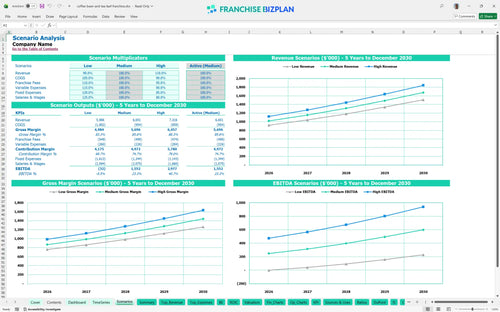
Three scenario analysis
Presentation ready
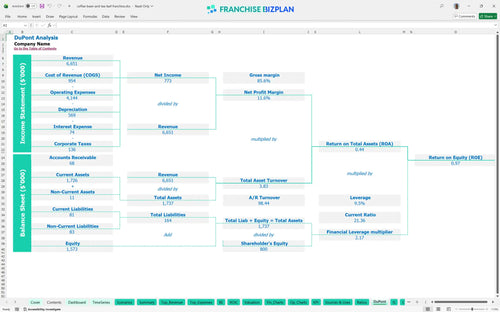
DuPont analysis
Researched revenue assumptions
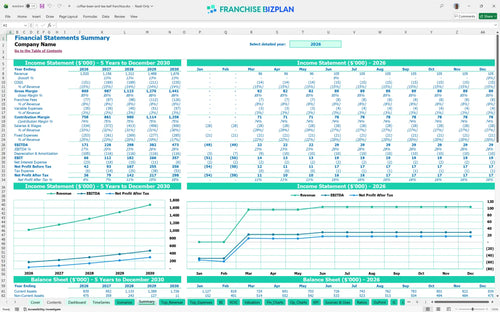
Lender-friendly financial outputs
Revenue stream detailed view
Performance metrics benchmark
We developed this franchise unit financial model based on deep research into the specialty beverage sector to provide a realistic roadmap for operators. The model comes pre-populated with researched data, including a $1.02M first-year revenue target and an initial $15,000 franchise fee, all of which are fully editable to match your specific Austin or luxury market location. This tool is designed to help you navigate the transition from initial build-out to a mature, cash-flowing asset.
The unit is projected to reach its break-even date in April 2026, just four months after launching. By year two, the coffee shop profit and loss template shows an EBITDA of $228,000 after accounting for all royalties and fixed costs.
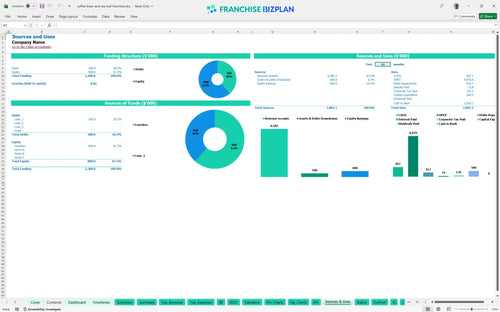
To launch this unit, you will need a total startup budget for luxury coffee shop franchise operations of approximately $580,000. This covers the $15,000 franchise fee, $280,000 in leasehold improvements, and $100,000 for high-end espresso equipment.
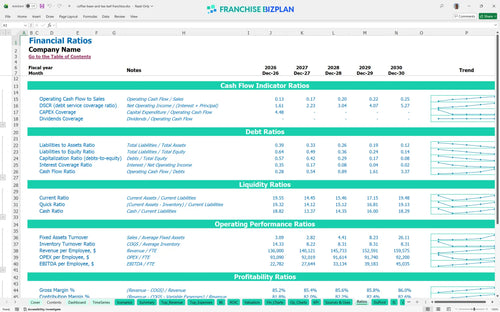
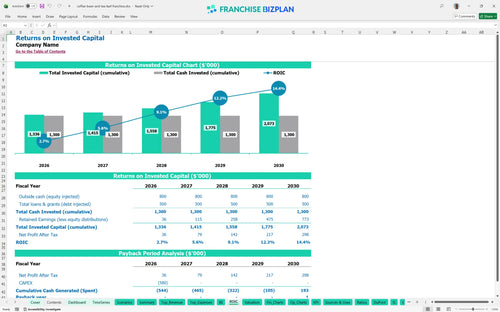
Using the coffee shop franchise ROI calculator, the model shows an Internal Rate of Return (IRR) of 2.6% and a Return on Equity (ROE) of 0.97. The total years to payback is estimated at 5 years based on the current growth trajectory.
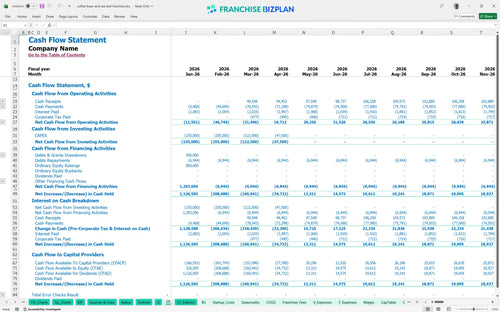
The coffee shop franchise cash flow projection indicates a break-even point in April 2026. The primary driver for this is the high fixed cost of $14,000 monthly rent, which requires consistent daily traffic to offset.
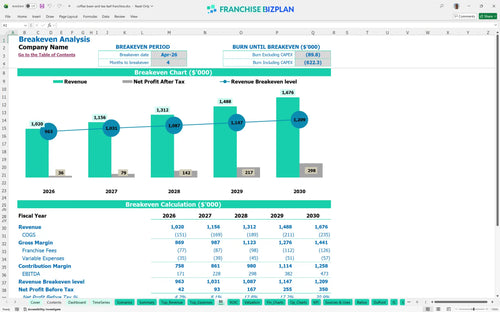
Your lowest cash point is $622,000 in April 2026, which means you defintely need a solid capital cushion to survive the initial ramp-up. Estimating operating expenses for coffee franchise units accurately is vital to prevent a liquidity crunch during the first 90 days.
A franchise unit profitability analysis guide shows that a 10% drop in revenue can delay your payback period by over 18 months. Conversely, hitting the high-case scenario through superior local marketing execution can significantly boost your year-1 margin above the projected 16.7% EBITDA.
This coffee shop franchise financial model is built in Excel with completely open formulas, allowing you to tweak every assumption to fit your specific territory. You can adjust the $14,000 monthly rent or the 5.5% royalty fee to see how local market shifts impact your bottom line. Every cell is open for your input.

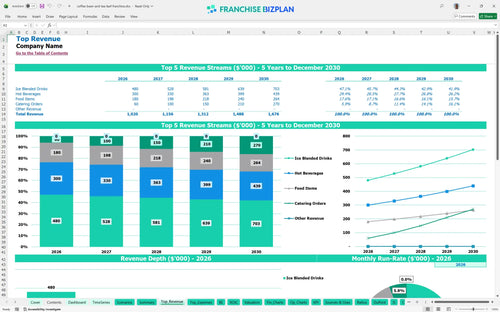
Mapping out a 5-year trajectory is essential for any franchise unit business plan template to ensure long-term viability. This model forecasts revenue growing from $1.02M in year one to over $1.67M by year five, giving you a clear view of your EBITDA calculation over time. Five years of clarity beats five months of guessing.

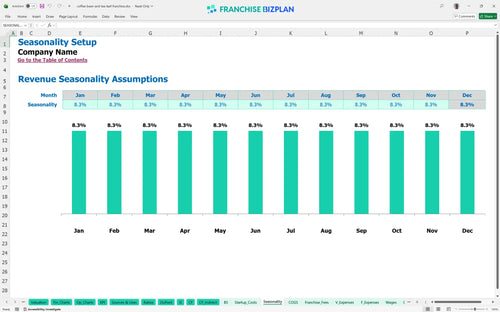
Managing franchise royalty fees is a critical part of your unit economics, as these costs come right off the top. This tool tracks the 5.5% royalty and 2.0% marketing fund contributions against your projected sales of Ice Blended drinks and catering. Royalties are a top-line tax; track them precisely.

Understanding how to calculate coffee shop franchise startup costs is the first step toward securing funding and managing your capital expenditure. The model provides a detailed break-even analysis, showing you exactly when your $1.02M in annual sales will finally cover your fixed and variable costs. Knowing your floor is as vital as knowing your ceiling.

This Excel template for coffee franchise financial forecasting includes benchmarks for labor and COGS (Cost of Goods Sold) so you can verify your projections. With beverage ingredients starting at 13% of sales, you can compare your store-level margin against typical specialty beverage standards. Don't fly blind when industry averages are available.


Simply purchase and download the financial model template, then access it instantly using Microsoft Excel or Google Sheets. No installation or technical expertise required-just open and start working.

Enter your business-specific numbers, including revenue projections, costs, and investment details. The pre-built formulas will automatically calculate financial insights, saving you time and effort.

Leverage the investor-ready format to confidently showcase your financial projections to banks, franchise representatives, or investors. Impress stakeholders with clear, data-driven insights and professional reports.

Leverage the investor-ready format to confidently present your projections to banks, franchise representatives, or investors.