
All-in-one Dashboard
Core inputs and core outputs


This comprehensive toolkit includes an Excel-based financial model with 5-year projections, startup cost trackers, and automated break-even calculators designed for a coding education unit.
Core inputs and core outputs
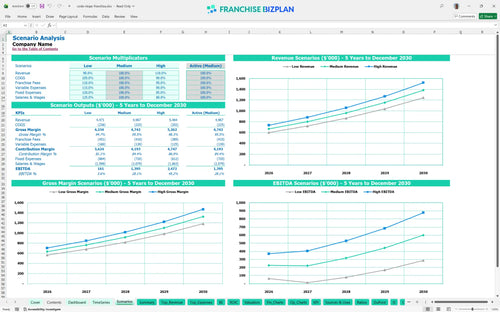
Three scenario analysis
Presentation ready
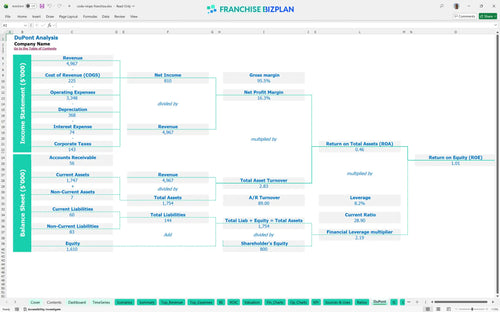
DuPont analysis
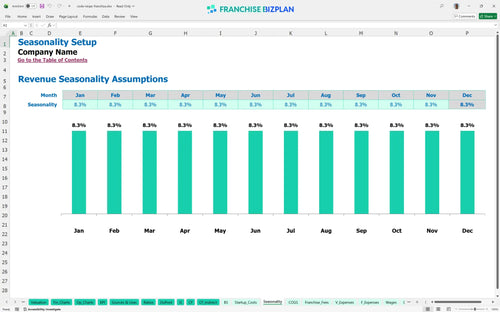
Researched revenue assumptions
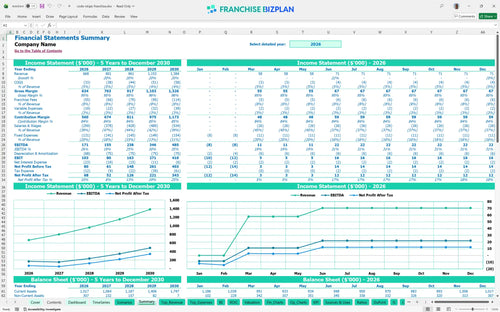
Lender-friendly financial outputs
Revenue stream detailed view
Performance metrics benchmark
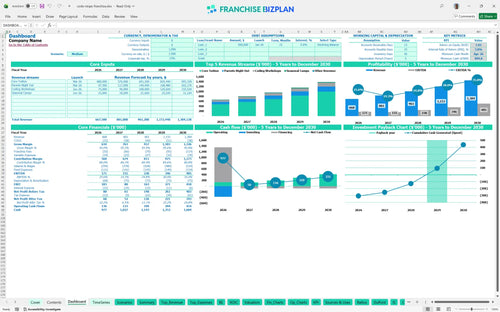
We built this STEM education franchise business plan using detailed research on unit-level performance and typical territory costs. The model includes pre-populated assumptions for core tuition revenue, which starts at $320,000 in year one, and specific operating costs like the $65,000 Dojo Chief salary. These numbers are fully editable, allowing you to tailor the projections to your specific market and facility size while maintaining a 4-year payback target.
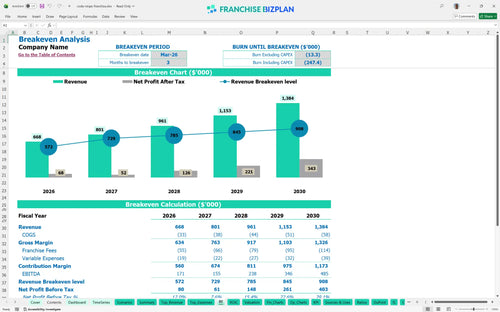
This franchise unit profit and loss template shows the business hitting break-even by March 2026, just three months after launching core operations. With EBITDA projected to grow from $171,000 in the first year to $485,000 by year five, the unit shows a strong upward trajectory as enrollment scales. Net profit is calculated after accounting for the 6% royalty and all local fixed costs like the $7,000 monthly rent.
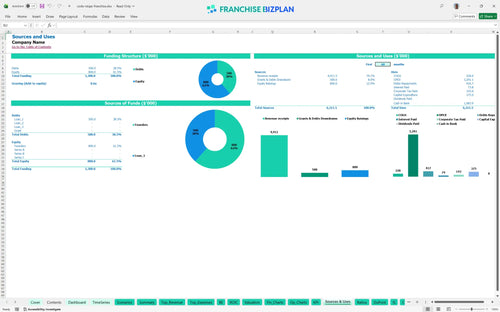
To launch this unit, you will need significant educational service startup capital to cover the $40,000 franchise fee and $160,000 in leasehold improvements. The total initial investment also includes $50,000 for computers and $35,000 for interactive displays to equip the learning environment. A cash buffer is essential to handle the early months before the March 2026 break-even point when revenue starts covering expenses.
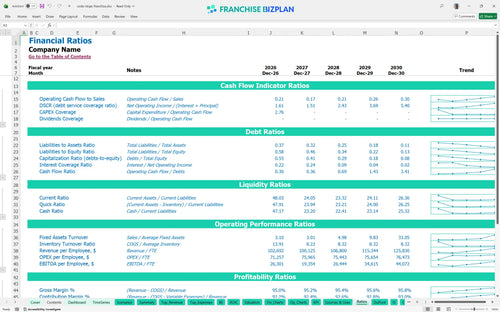
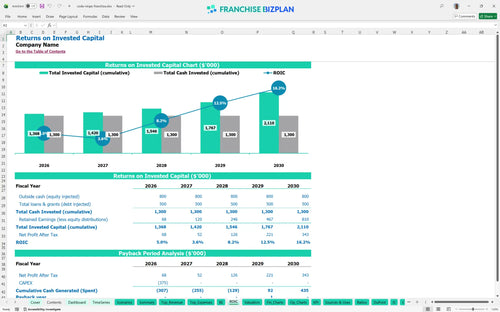
The franchise investment ROI analysis indicates a 4-year payback period and an internal rate of return of 3.78% based on current projections. While the initial years focus on recovering the startup costs, the return on equity reaches 1.01 as the unit matures and revenue hits $1.38 million. These metrics are based on the steady growth of recurring tuition and supplemental revenue streams like coding workshops.
Knowing how to calculate startup costs for a coding franchise is only half the battle; you must also identify the monthly revenue needed to cover fixed overhead. This unit hits break-even in March 2026, driven primarily by the core tuition revenue which is forecasted at $320,000 for the first year. Managing the $1,750 monthly spend on utilities and internet is key to protecting these early store-level margins.
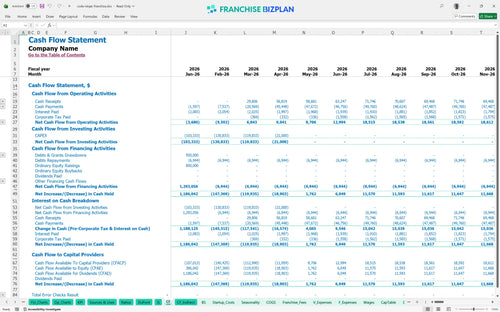
The monthly recurring revenue model for education franchises helps stabilize cash flow, but the lowest cash point occurs in April 2026 at $900,000. You will need a solid runway to cover the $15,000 in monthly salaries for the Dojo Chief, Lead Sensei, and Front Desk Coordinator during the ramp-up. Maintaining a buffer is defintely recommended to handle any delays in student enrollment or facility build-out.
Applying best practices for franchise unit financial planning involves testing Low, Medium, and High scenarios to see how they impact your $171,000 year-one EBITDA. A high-performance scenario, driven by better student retention and higher workshop volume, can significantly shorten the 4-year payback period. Conversely, a low-growth case might require additional working capital if the March 2026 break-even date slips by a few months.
This franchise financial model template provides a flexible Excel environment where you can adjust every variable to fit your specific territory. It includes pre-filled formulas that link your revenue drivers to the bottom line, making it simple to test different enrollment levels or pricing tiers. You can edit the logic for staff wages or rent to match your specific real estate deal and local labor market.

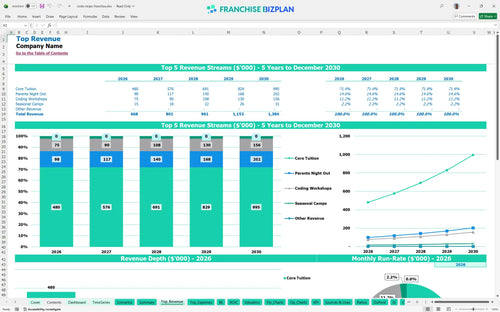
Long-term planning is vital for any after-school program business model to ensure you can weather the early ramp-up phase. This franchise financial projection spreadsheet maps out five years of performance, showing how revenue scales from $668,000 in year one to over $1.38 million by year five. It gives you a clear view of how your balance sheet and cash flow evolve as the unit matures and gains market share.

Understanding the impact of recurring fees is critical for accurate franchise royalty fee calculation and store-level margin analysis. The model accounts for the 6% royalty and 2.25% marketing fund contributions that come right off the top of your gross sales. By tracking these alongside the initial $40,000 franchise fee, you get a realistic picture of your ongoing financial obligations to the brand system.

Planning for children's education franchise startup costs requires a deep dive into both fixed and variable expenses before you open your doors. This tool includes a franchise unit break-even analysis spreadsheet that identifies exactly when your monthly revenue covers your $7,000 rent and other overhead. It helps you visualize the total investment needed before the business starts paying for itself through student tuition.

This model uses STEM center operating expenses benchmarks to help you sanity-check your local projections against industry standards. We have included ranges for labor, which is your biggest cost, and occupancy to ensure your plan is grounded in reality. Comparing your expected gross margins against these standards helps you identify potential margin leaks before you sign a long-term lease.


Simply purchase and download the financial model template, then access it instantly using Microsoft Excel or Google Sheets. No installation or technical expertise required-just open and start working.

Enter your business-specific numbers, including revenue projections, costs, and investment details. The pre-built formulas will automatically calculate financial insights, saving you time and effort.

Leverage the investor-ready format to confidently showcase your financial projections to banks, franchise representatives, or investors. Impress stakeholders with clear, data-driven insights and professional reports.

Leverage the investor-ready format to confidently present your projections to banks, franchise representatives, or investors.