
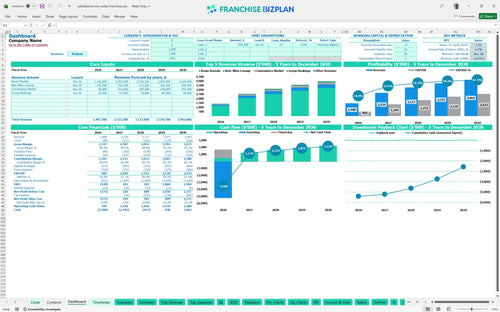
All-in-one Dashboard
Core inputs and core outputs


This comprehensive Excel template for hotel franchise financial forecasting includes dynamic revenue drivers, detailed CAPEX schedules, and full 5-year pro forma statements tailored for the hospitality sector.
Core inputs and core outputs
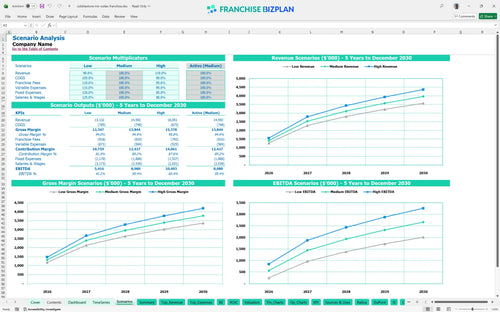
Three scenario analysis
Presentation ready
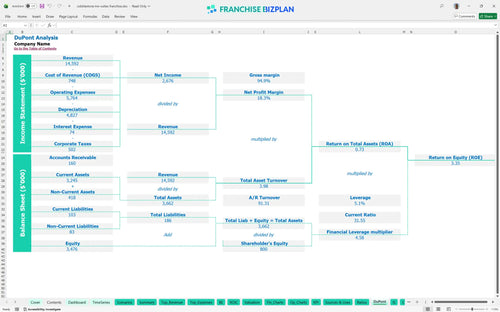
DuPont analysis
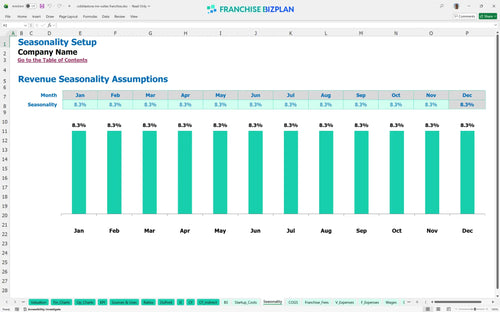
Researched revenue assumptions
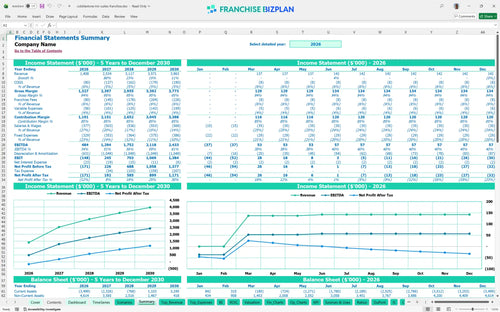
Lender-friendly financial outputs
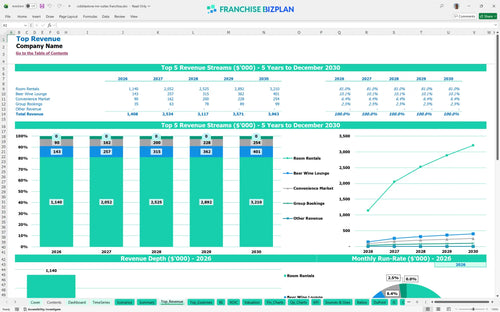
Revenue stream detailed view
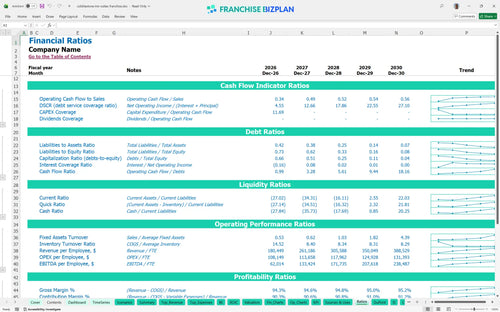
Performance metrics benchmark
We built this franchise unit financial model using our own research into the limited-service hotel sector. Key assumptions like the $45,000 franchise fee, 3.71% royalty, and $3.5M construction costs are pre-populated and fully editable to match your specific territory. With year 1 revenue projected at $1.4M and EBITDA scaling to $2.4M by year 5, this model provides a data-driven foundation for your investment feasibility study.
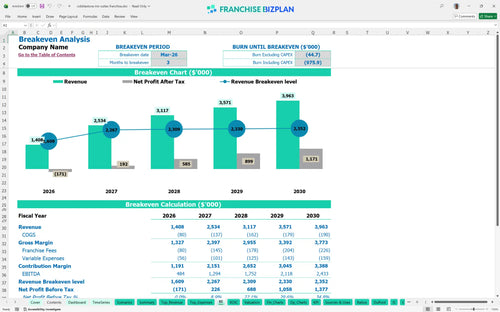
This franchise unit is projected to reach its break-even date in March 2026, just three months after launch. While year 1 EBITDA starts at $484,000, the model shows significant scaling as room rentals and group bookings mature, hitting $1.75M in EBITDA by year 3. Here's the quick math: your margins improve as fixed costs like property insurance and taxes are spread over a larger revenue base.
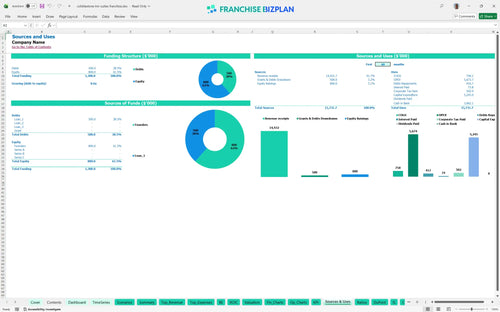
Launching this hotel franchise in the US requires a substantial initial investment, primarily driven by building construction and site preparation. The total uses of funds exceed $5M, including the franchise fee and a significant $650,000 for guest room FF&E (Furniture, Fixtures, and Equipment). You must ensure your sources of capital cover these heavy upfront costs plus the initial operating losses during the first few months of ramp-up.
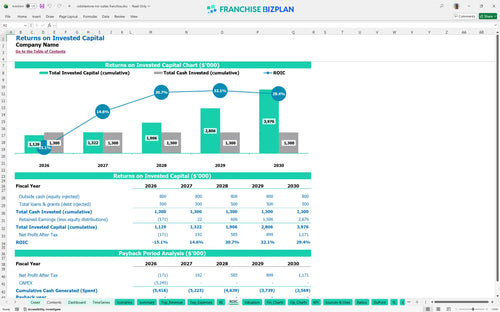
The model projects an Internal Rate of Return (IRR) of 1.14% and a Return on Equity (ROE) of 3.35% over the initial 5-year period. While the payback period extends beyond year 5, the steady climb in EBITDA to $2.43M by year 5 suggests strong long-term asset value. What this estimate hides is the potential for terminal value if you sell the stabilized property after the 5-year mark.
The monthly break-even point is achieved in month 3, provided you hit the target room rental revenue of $760,000 in your first partial year. The primary driver for break-even is occupancy rate; with fixed costs like the $15,000 lease and $90,000 GM salary, you need consistent volume to cover the nut. If your room rates or occupancy dip by even 10%, that break-even date will slide fast.
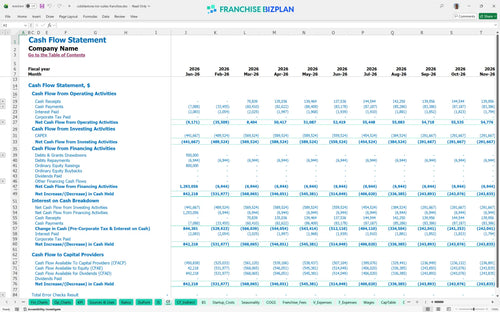
The lowest cash point occurs in December 2026, with a projected minimum cash balance of -$3,580,000. This indicates a massive funding gap if construction is financed out of pocket or if loan draws don't align with contractor payments. You need a significant capital reserve or a robust construction loan to survive the build-out phase before the revenue from room rentals starts flowing in March.
In a High scenario, increasing your average daily rate by 10% can pull the payback period forward and significantly boost your year 1 margin. Conversely, a Low scenario with 20% lower occupancy would likely result in deeper cash troughs and a much slower ramp-up. The model shows that your year 5 EBITDA is highly sensitive to the 3.71% royalty burden and 30% total labor costs.
This hotel franchise financial model is built in Excel to give you full control over your hospitality investment. It features pre-filled formulas and editable assumptions, so you can easily adjust for your specific site, local labor rates, and room pricing strategies. Honestly, a static plan is useless in a shifting market, but this tool lets you stress-test your numbers before you sign a lease.

Success in the hospitality industry ROI (Return on Investment) isn't found in month one; it requires a 5-year view of revenue and cash flow. This model provides detailed projections for room rentals, lounge sales, and market revenue to help you map out the climb from opening day to a mature, stabilized asset. You need to see how year 5 revenue of $3.96M compares to the lean startup months to plan your growth strategy effectively.

Operating a branded hotel means managing a specific franchise royalty fee structure that eats into your top line. This model tracks the 3.71% royalty and 2% marketing fee automatically, ensuring you see the true net cash left for the owner. By calculating these obligations upfront, you can defintely avoid the common mistake of overestimating your store-level margin before brand costs are paid.

Calculating hotel franchise startup costs is the most critical step for any new owner. This tool breaks down everything from the $45,000 initial fee to the $3.5M construction bill, helping you identify exactly when you will reach the break-even point. Knowing your fixed costs, like the $15,000 monthly lease, allows you to set the right average daily rate to cover your overhead.

We have integrated hospitality industry benchmarks to help you sanity-check your operating expenses. Whether you are looking at linen supplies at 3.8% or OTA commissions at 2.8%, these numbers help you see if your projections are realistic compared to other limited-service hotels. It is a vital budgeting tool for new hotel franchise owners who need to verify their labor and utility assumptions against real-world data.


Simply purchase and download the financial model template, then access it instantly using Microsoft Excel or Google Sheets. No installation or technical expertise required-just open and start working.

Enter your business-specific numbers, including revenue projections, costs, and investment details. The pre-built formulas will automatically calculate financial insights, saving you time and effort.

Leverage the investor-ready format to confidently showcase your financial projections to banks, franchise representatives, or investors. Impress stakeholders with clear, data-driven insights and professional reports.

Leverage the investor-ready format to confidently present your projections to banks, franchise representatives, or investors.