
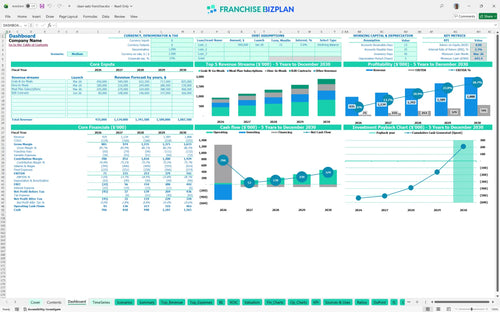
All-in-one Dashboard
Core inputs and core outputs


This franchise unit financial model template includes a comprehensive Excel spreadsheet for franchise business financial planning, featuring automated P&L statements, startup cost calculators, and health-focused revenue drivers.
Core inputs and core outputs
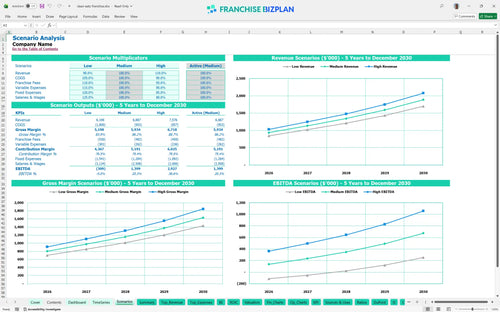
Three scenario analysis
Presentation ready
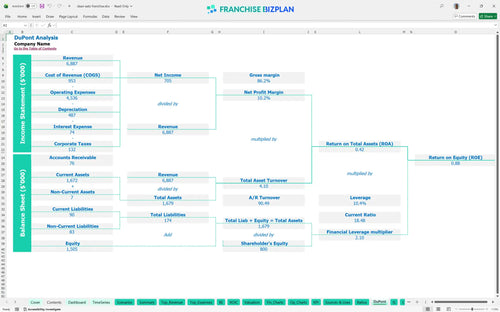
DuPont analysis
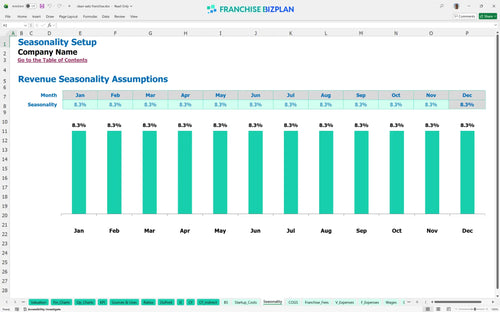
Researched revenue assumptions
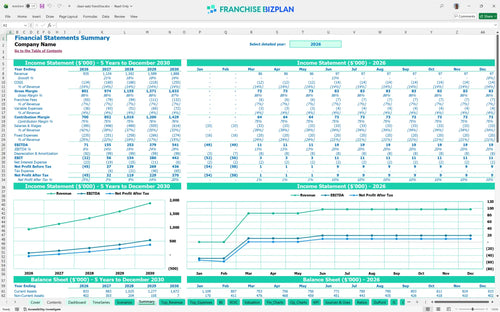
Lender-friendly financial outputs
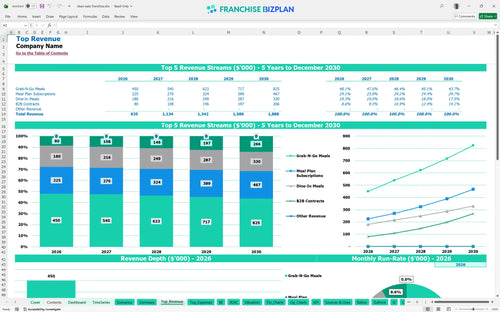
Revenue stream detailed view
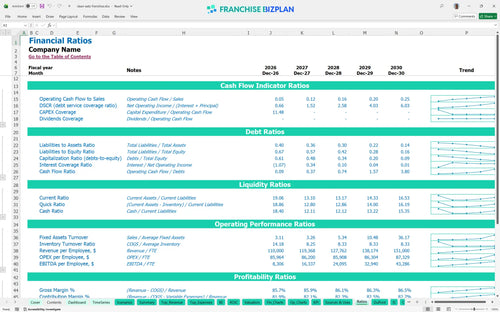
Performance metrics benchmark
We built this franchise unit financial model using our own research into the health-focused fast-casual sector. Key assumptions, including the $49,500 franchise fee, $14,000 monthly rent, and revenue streams like Grab-N-Go meals, are pre-populated and fully editable to help you prepare a financial forecast for a franchise loan. Speed to profit depends on your ability to scale meal plan subscriptions and B2B contracts alongside traditional dine-in traffic.
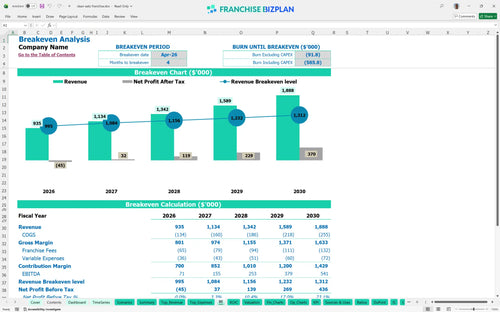
Based on the researched data, this franchise unit becomes profitable in April 2026, just four months after the initial launch. This assumes you hit the $935,000 year-one revenue target while keeping food ingredients at 11.5% and royalties at 6% of gross sales.
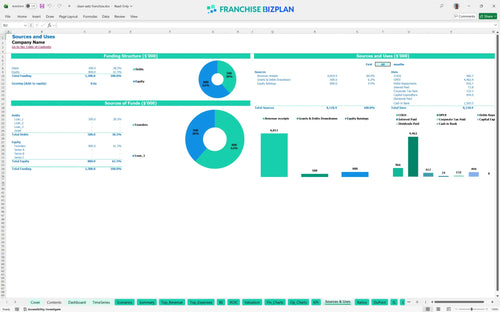
You will need approximately $494,000 to launch this franchise unit in the US, which covers the $49,500 franchise fee and significant leasehold improvements. This investment analysis includes $95,000 for kitchen equipment and a $14,000 initial inventory load to ensure a smooth opening.
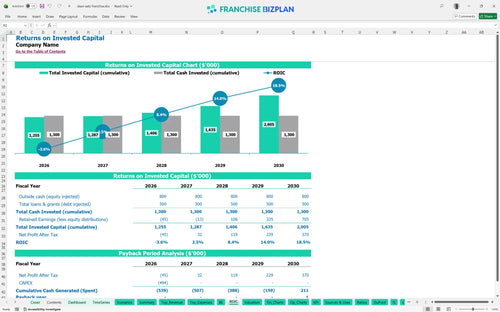
The model projects an Internal Rate of Return (IRR) of 2.32% with a 5-year payback period, reflecting the high initial CAPEX of a premium build-out. While the ROE stands at 0.88, the long-term value lies in the year-five EBITDA, which is projected to reach $541,000 as the location matures.
The monthly break-even point occurs in month 4, requiring the unit to cover $14,000 in rent and $2,300 in utilities. The primary driver for reaching this point is the volume of Grab-N-Go meals, which defintely accounts for the largest portion of the early revenue mix.
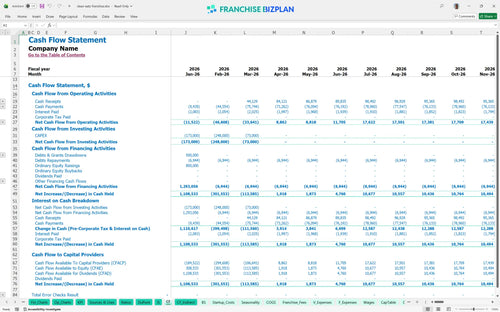
The lowest cash point occurs in March 2026, with a minimum cash requirement of $693,000 to navigate the pre-opening and initial ramp-up phase. Managing operating expenses in a food franchise unit during this window is critical to maintaining a healthy cash runway before the unit turns cash-flow positive.
Our franchise business model financial projection template allows you to stress-test how Low, Medium, and High scenarios impact your bottom line. A shift to the High case, driven by aggressive local marketing and corporate partnerships, can significantly pull forward the 5-year payback and improve the year-one $71,000 EBITDA.
This franchise unit financial model is fully customizable in Excel, allowing you to swap out every assumption to match your specific territory. Whether you are adjusting for local labor rates or specific lease terms, the pre-filled formulas handle the heavy lifting and make it easy to adapt to your specific operating scenario.

Evaluating a restaurant franchise business plan requires a multi-year view to see how margins evolve as the unit matures. Our model provides detailed 5-year revenue, cost, and profit projections tailored for a single unit or a small franchise chain, helping you visualize the path from opening day to a mature operation.

We baked in the 6% royalty and 1% marketing fund contributions so you can see exactly how much goes to the franchisor every month. Tracking these franchise royalty fee calculation steps ensures you understand the real economics of the unit before local overhead eats into your take-home pay.

Knowing how to calculate startup costs for a fast-casual franchise is the first step toward securing funding and managing your bankroll. This tool maps out the total initial investment and identifies the break-even point analysis needed to cover your $14,000 monthly rent and other fixed costs.

The model incorporates built-in franchise and industry benchmarks for key metrics like food ingredients and labor, helping you sanity-check your assumptions. Comparing your expected performance against typical ranges ensures your food franchise profit projection stays grounded in reality.


Simply purchase and download the financial model template, then access it instantly using Microsoft Excel or Google Sheets. No installation or technical expertise required-just open and start working.

Enter your business-specific numbers, including revenue projections, costs, and investment details. The pre-built formulas will automatically calculate financial insights, saving you time and effort.

Leverage the investor-ready format to confidently showcase your financial projections to banks, franchise representatives, or investors. Impress stakeholders with clear, data-driven insights and professional reports.

Leverage the investor-ready format to confidently present your projections to banks, franchise representatives, or investors.