
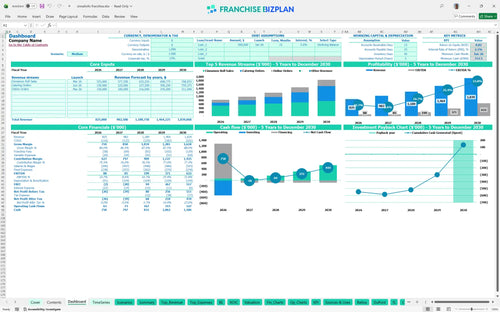
All-in-one Dashboard
Core inputs and core outputs


This financial projection model for dessert shop franchise includes a full 5-year small business franchise profit and loss statement example and a startup budget template for retail food franchise.
Core inputs and core outputs
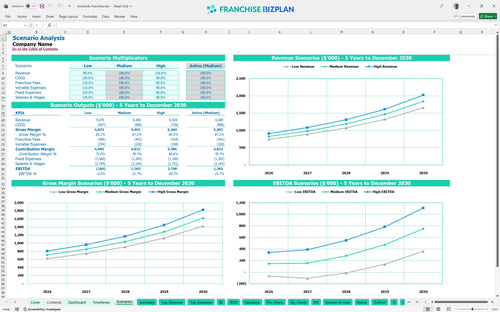
Three scenario analysis
Presentation ready
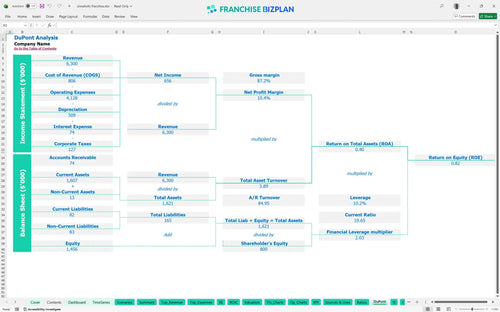
DuPont analysis
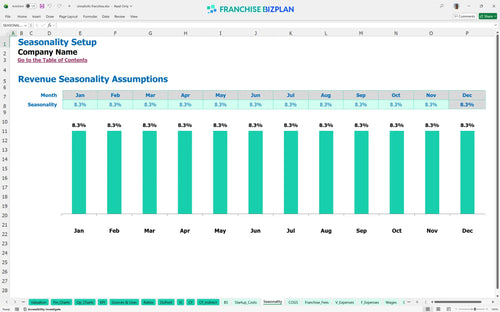
Researched revenue assumptions
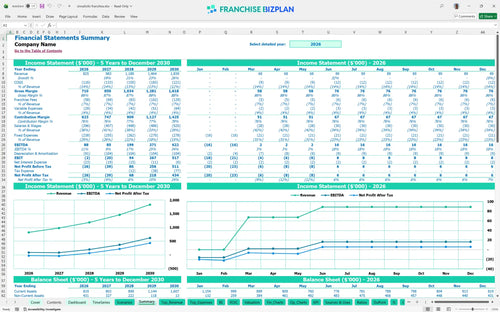
Lender-friendly financial outputs
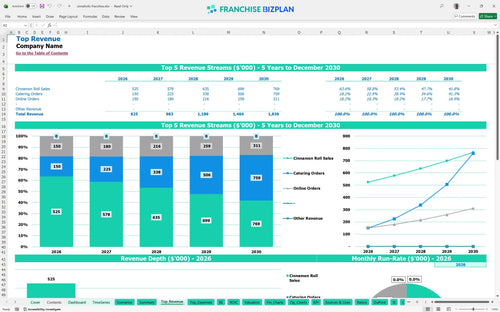
Revenue stream detailed view
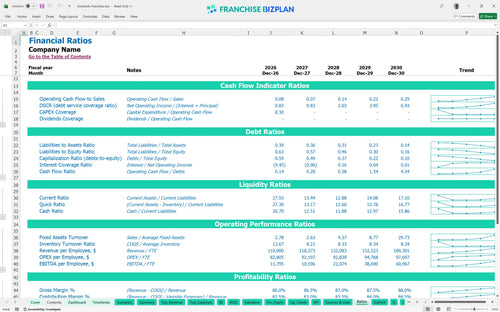
Performance metrics benchmark
We built this franchise unit financial model using our own research to help you evaluate the real-world potential of a plant-based bakery. Key assumptions like the $522,000 initial investment and the $825,000 year-one revenue are pre-populated and fully editable to match your specific territory goals.
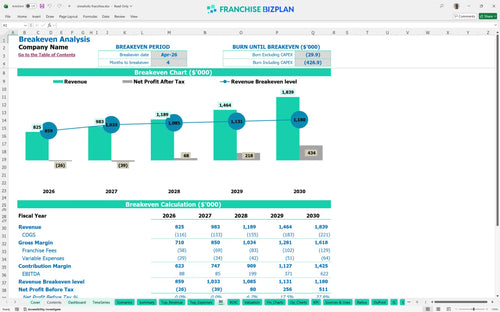
This franchise profitability analysis shows the unit reaching break-even in April 2026, just four months after launch. While year one EBITDA is $88,000, the real acceleration happens by year five, reaching $622,000 as you succeed in predicting revenue for a new franchise location. Year five is where the real wealth is built.
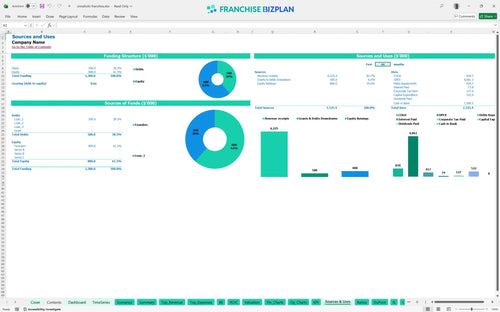
Launching this financial model for plant-based dessert business requires $522,000 in total capital. This includes the $40,000 franchise fee and $250,000 for leasehold improvements to create the required aesthetic. Build-out is your biggest check.
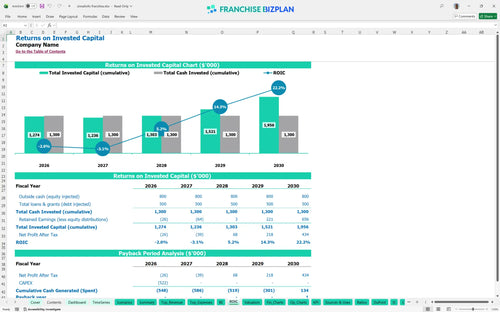
The ROI calculation is the ultimate metric for any franchise unit budget planning spreadsheet. This model projects a 5-year payback period with an internal rate of return (IRR) of 2.05% and a return on equity (ROE) of 0.82 based on essential financial metrics for franchise owners. Payback takes discipline.
The unit hits its monthly break-even point in April 2026. Success depends heavily on managing the $14,000 monthly rent and ensuring the $350,000 in year-one cinnamon roll sales stay on track. Speed to break-even is the goal.
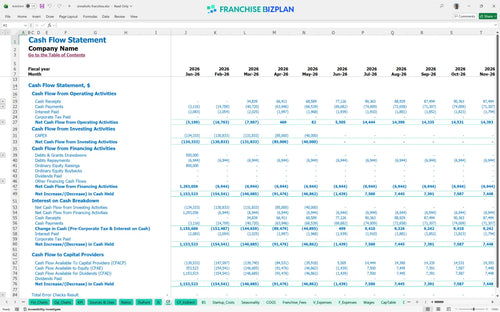
The lowest cash point is $713,000 in June 2026. You need enough runway to cover the ramp-up period, as the $100,000 in year-one online orders takes time to stabilize defintely. Watch your cash like a hawk.
Using this Excel template for retail franchise financial forecasting, we compare low, medium, and high cases. A 10% revenue swing impacts the $88,000 year-one EBITDA significantly, but high-case success is driven by hitting the $506,250 catering target. Plan for the worst, execute for the best.
Finance: update unit break-even and payback model by Friday
This franchise financial model template is built in Excel to let you swap out assumptions as fast as market conditions change. You can adjust everything from the $14,000 monthly prime location rent to the 12% food ingredient cost to see how it hits your bottom line. Every 1-point margin leak matters fast in a single-unit model.

Planning for a bakery franchise business plan requires looking past the first year of $825,000 in sales. This model tracks your franchise unit financial projections through year five, where revenue is projected to hit $1.839 million as catering and online orders scale. Growth depends on scaling catering to hit those long-term targets.

Every dollar counts when you are paying a 5% royalty and a 2% marketing fee on gross sales. At $825,000 in annual revenue, that is $57,750 leaving the unit before you pay for a single bag of flour or a kilowatt of power. Royalties are a top-line tax you must manage with high throughput.

Your restaurant startup cost spreadsheet needs to account for the $522,000 required to open the doors, including $250,000 for leasehold improvements and $110,000 for ovens and mixers. Knowing how to calculate startup costs for a bakery franchise is critical for managing your opening cash buffer. Cash is king during the build-out phase.

We use franchise unit economics to sanity-check your numbers against industry standards while estimating operating costs for a food franchise. If your food ingredients are at 12% but your labor for a store manager, assistant manager, and head baker exceeds $176,000 annually, the model helps you see where the margin leak is happening. Benchmarks keep your ego in check.


Simply purchase and download the financial model template, then access it instantly using Microsoft Excel or Google Sheets. No installation or technical expertise required-just open and start working.

Enter your business-specific numbers, including revenue projections, costs, and investment details. The pre-built formulas will automatically calculate financial insights, saving you time and effort.

Leverage the investor-ready format to confidently showcase your financial projections to banks, franchise representatives, or investors. Impress stakeholders with clear, data-driven insights and professional reports.

Leverage the investor-ready format to confidently present your projections to banks, franchise representatives, or investors.