


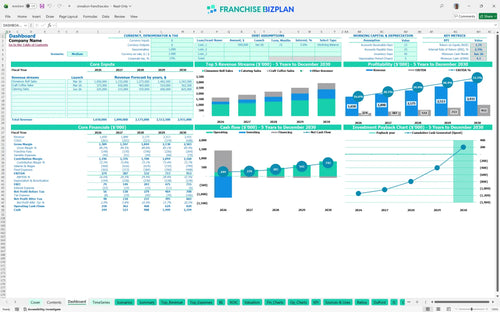
All-in-one Dashboard
Core inputs and core outputs



This franchise financial model provides a professional-grade toolkit for projecting revenue, managing high-volume bakery expenses, and calculating long-term investor returns.
Core inputs and core outputs
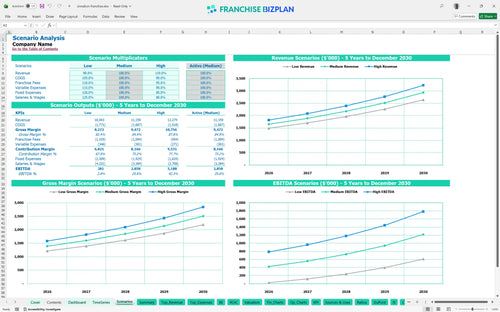
Three scenario analysis
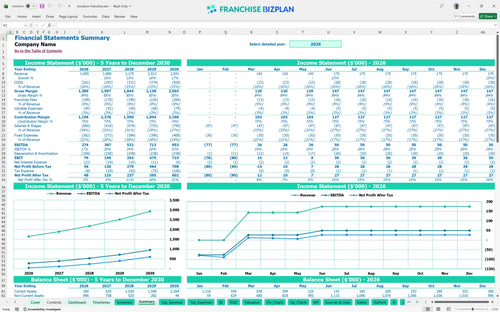
Presentation ready
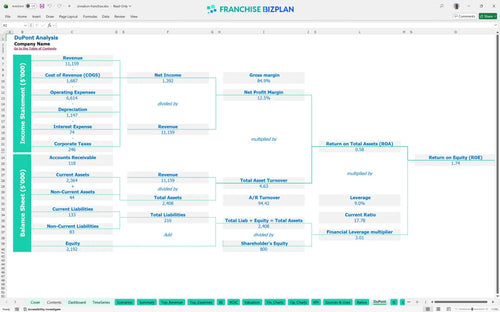
DuPont analysis
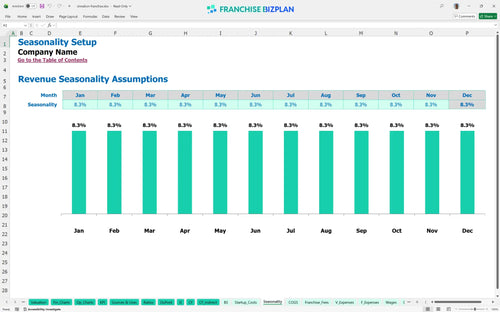
Researched revenue assumptions
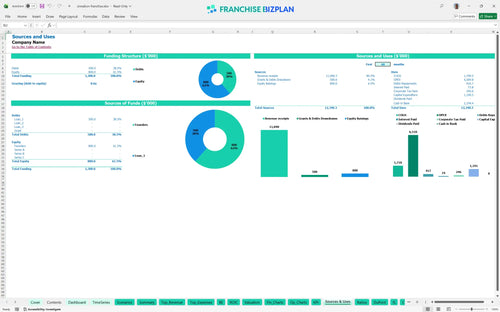
Lender-friendly financial outputs
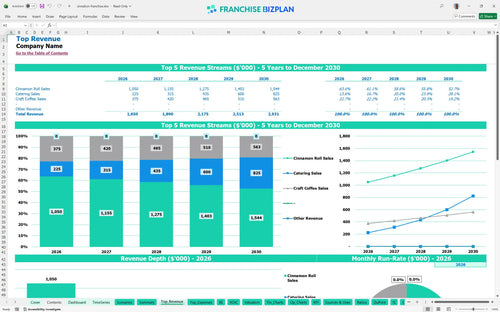
Revenue stream detailed view
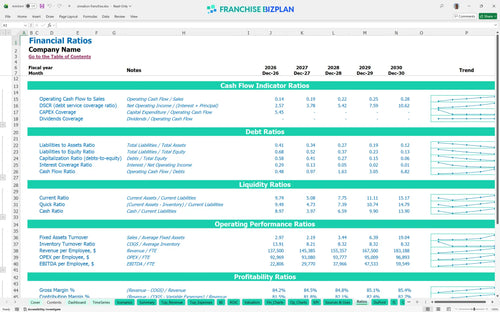
Performance metrics benchmark
We built this franchise unit financial model based on researched data for high-traffic bakery locations in premier retail developments. All assumptions, including the $1.65 million year-one revenue target and 6% royalty fees, are pre-populated but fully editable to fit your specific territory. This is defintely a practical tool for owners who need to move from a business idea to a funded operation.
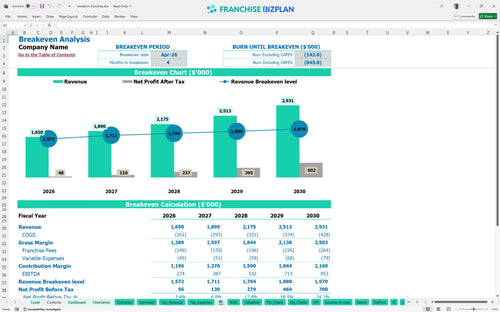
The unit reaches profitability quickly, hitting its break-even date in April 2026, just four months after opening. While year one produces $274,000 in EBITDA, the model shows profit nearly tripling by year five as catering and delivery channels reach full scale. Speed to profit is the best hedge against market risk.
You need $1,190,500 to launch this unit, with $500,000 allocated to leasehold improvements and $250,000 for specialized baking equipment. This total includes the initial franchise fee and a $50,000 inventory buffer to handle grand opening traffic. Build-outs always cost more than the initial quote.
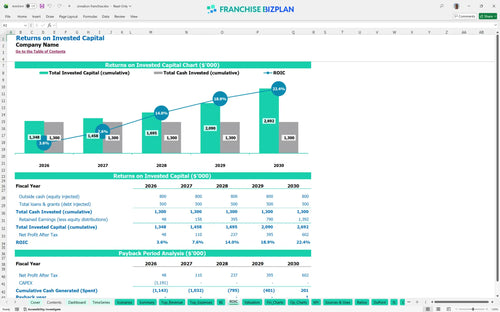
The model projects a 5-year payback period with an Internal Rate of Return (IRR) of 2.32% and a 1.74 Return on Equity. While the initial cash outlay is significant, the unit generates nearly $1 million in annual EBITDA by year five, creating substantial enterprise value. This is a long-term asset play, not a quick flip.
Monthly break-even requires covering approximately $30,400 in fixed costs, with the $20,000 prime location rent being the primary driver. You must maintain high throughput and a strong average ticket to clear this hurdle by month four. Rent is fixed, but your effort isn't.
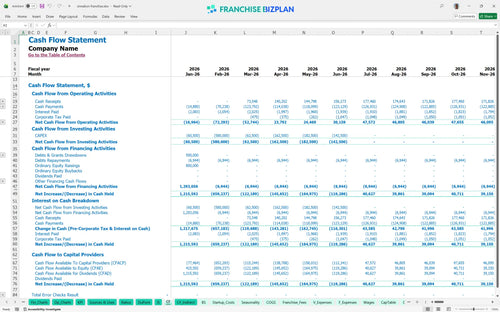
The lowest cash point hits in June 2026 at just $4,000, meaning there is very little room for error during the first six months. We suggest a larger cash buffer if your leasehold improvements or equipment deliveries face any delays. Cash is oxygen for a new bakery.
A high-performance scenario increases year-five EBITDA by hundreds of thousands, while a low-revenue year one could push your cash balance into the negative. Success depends on executing the 'theater-style' baking experience to drive the foot traffic needed for those $1.65 million base sales. Execution beats a good spreadsheet every time.
Finance: update unit break-even and payback model by Friday.
This franchise financial model is built in Excel with fully editable assumptions, allowing you to swap out pre-filled data for your specific site costs. You can adjust the $20,000 monthly rent or the 14% food cost to see exactly how local variables impact your bottom line. Every 1-point margin leak matters fast in a single-unit model.

We mapped out a detailed five-year growth path where annual revenue scales from $1.65 million to over $2.9 million as you mature. This long-term view tracks EBITDA growth from $274,000 in year one to $953,000 in year five, helping you plan for multi-unit expansion or a future exit. It's not just about opening day; it's about the exit value.

The model handles the heavy lifting of calculating a 6% royalty and 3% marketing fund contribution against your monthly sales forecasts. By including the initial $30,500 franchise fee in the startup math, you get a clear picture of your total obligation to the brand. Royalties are a tax on top-line revenue, not profit.

Launching this unit requires a total investment of $1.19 million, with leasehold improvements and equipment making up the bulk of the spend. The model identifies the exact sales volume needed to cover your $30,000+ in monthly fixed costs, including rent and utilities. Break-even is the most important milestone for any new owner.

We include researched benchmarks like a 14% food ingredient cost and 1.8% packaging expense to help you sanity-check your projections. Comparing your local labor spend against these QSR standards ensures your business plan stays grounded in reality. If your numbers look too good to be true, they probably are.


Simply purchase and download the financial model template, then access it instantly using Microsoft Excel or Google Sheets. No installation or technical expertise required-just open and start working.

Enter your business-specific numbers, including revenue projections, costs, and investment details. The pre-built formulas will automatically calculate financial insights, saving you time and effort.

Leverage the investor-ready format to confidently showcase your financial projections to banks, franchise representatives, or investors. Impress stakeholders with clear, data-driven insights and professional reports.

Leverage the investor-ready format to confidently present your projections to banks, franchise representatives, or investors.