
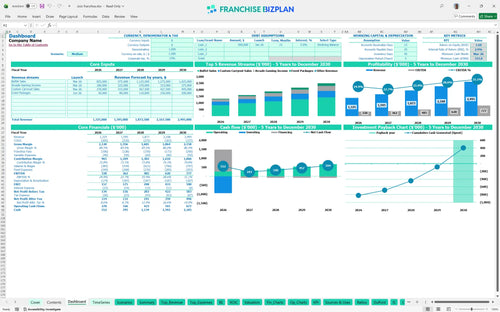
All-in-one Dashboard
Core inputs and core outputs


This Excel template for restaurant franchise financial projections includes everything needed to evaluate a multi-revenue stream pizza and entertainment concept with precision.
Core inputs and core outputs
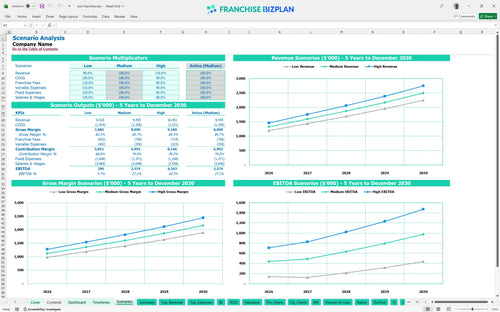
Three scenario analysis
Presentation ready
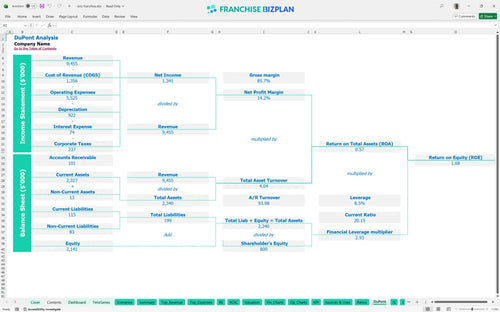
DuPont analysis
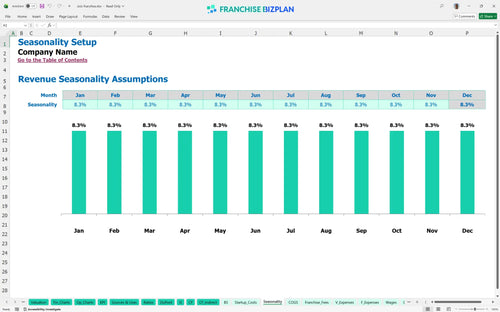
Researched revenue assumptions
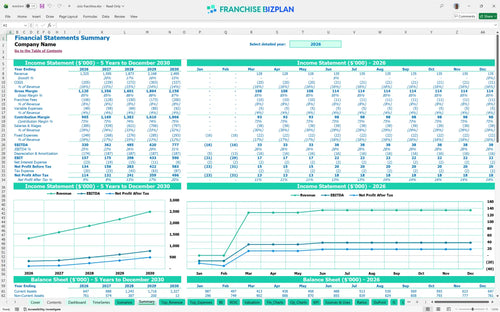
Lender-friendly financial outputs
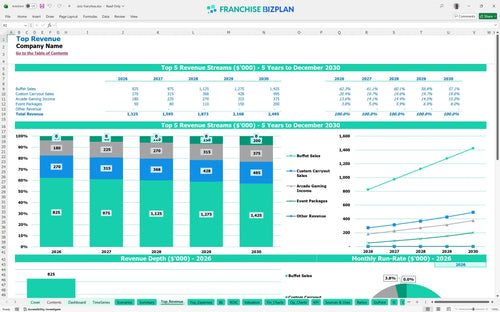
Revenue stream detailed view
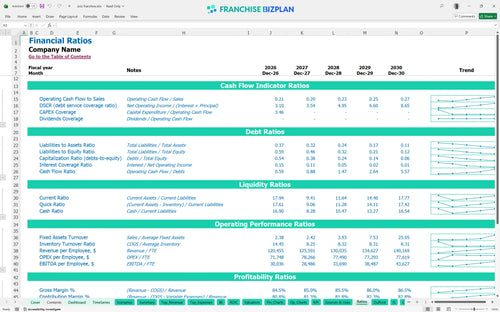
Performance metrics benchmark
We built this franchise unit financial model using detailed research into the buffet and entertainment sector. Key assumptions for buffet sales, arcade income, and carryout revenue are pre-populated with data showing year-one sales of $1,325,000 and a five-year payback period. Every input is fully editable to match your specific territory and lease terms.
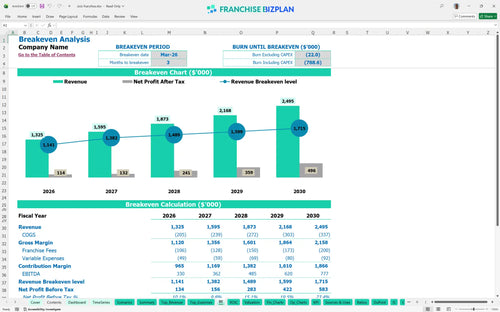
The unit reaches profitability in March 2026, just three months after the initial launch. By year five, EBITDA is projected to hit $777,000 as the buffet and arcade revenue streams reach maturity. Here is the quick math: unit economics improve as food waste drops and arcade margins remain high.
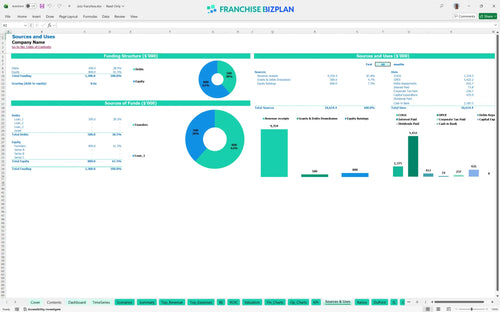
You need approximately $935,000 to launch this franchise unit in the US, covering everything from the $30,000 franchise fee to the $350,000 build-out. This capital expenditure budget ensures you have enough liquidity to cover the $250,000 arcade investment and a $323,000 cash buffer during the ramp-up phase.
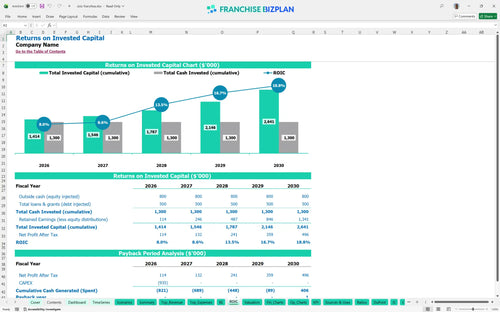
The franchise investment feasibility study indicates a 2.9% internal rate of return and a 5-year payback period. While the initial ROI calculation shows a 1.68 return on equity, the long-term value is driven by the steady growth in annual EBITDA from $330,000 to $777,000. What this estimate hides is the potential for higher returns through multi-unit scaling.
Break-even occurs in March 2026, requiring about $110,000 in monthly revenue to cover fixed and variable costs. The primary driver is throughput; you must manage the $14,000 monthly rent and $18,000+ in monthly management salaries by maintaining high guest counts. Calculating break-even point for buffet restaurant units helps you set daily traffic goals for your team.
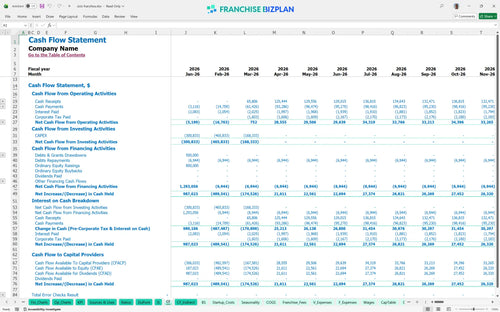
Your lowest cash point is $323,000 in March 2026, which is exactly when the unit is expected to break even. This means you need a solid working capital reserve to handle the first 90 days of payroll for your 10+ kitchen and service staff members. To be fair, any delay in the $350,000 build-out will increase this cash pressure significantly.
Revenue forecasting for family entertainment centers shows that hitting the high case depends heavily on arcade and event package growth. If arcade income hits $250,000 instead of $120,000, your year-1 margin expands rapidly, shortening the 5-year payback period. Still, the model shows the unit remains viable even if carryout sales grow slower than the projected 15% annual rate.
This franchise financial model template provides a flexible Excel framework to test your specific assumptions. You can adjust every variable from buffet pricing to arcade credit margins to see how they impact your bottom line. The model allows for quick pivots in your pizza restaurant business plan when local rent or labor rates shift during negotiations.

Detailed 5-year projections show revenue scaling from $1.32M in year one to nearly $2.5M by year five. This restaurant profitability analysis helps you visualize the long-term compounding effect of local marketing and repeat guest traffic. It maps out the transition from a single-unit startup to a mature, high-volume entertainment destination.

Managing the franchise royalty and fee structure analysis is simple with dedicated inputs for the 5% royalty and 3% marketing fund. These fees are calculated automatically against gross sales, so you see the exact impact on store-level EBITDA. This ensures you account for every dollar owed to the franchisor before calculating your take-home pay.

Use the franchise startup cost calculator to map out the $935,000 total initial investment required for this concept. Calculating break-even point for buffet restaurant operations is critical, and this model shows you exactly when your monthly revenue covers your $14,000 rent and other fixed costs. It provides a clear target for your first 90 days of operation.

This model includes an operational cost breakdown for pizza restaurants based on researched data. With food costs starting at 13.5% and trending down to 11.5% as volume increases, you can defintely benchmark your performance against industry standards. It helps you identify margin leaks in packaging or utilities before they impact your cash runway.


Simply purchase and download the financial model template, then access it instantly using Microsoft Excel or Google Sheets. No installation or technical expertise required-just open and start working.

Enter your business-specific numbers, including revenue projections, costs, and investment details. The pre-built formulas will automatically calculate financial insights, saving you time and effort.

Leverage the investor-ready format to confidently showcase your financial projections to banks, franchise representatives, or investors. Impress stakeholders with clear, data-driven insights and professional reports.

Leverage the investor-ready format to confidently present your projections to banks, franchise representatives, or investors.