
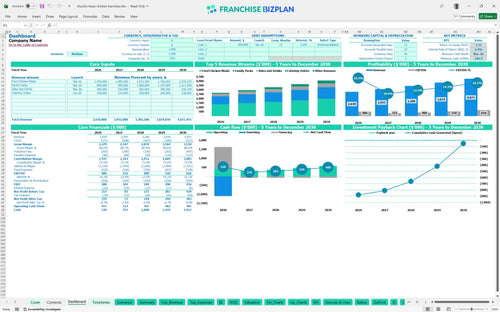
All-in-one Dashboard
Core inputs and core outputs


This comprehensive financial toolkit includes a 5-year income statement, detailed CAPEX schedules, and a dynamic break-even calculator designed for high-volume chicken restaurant operators.
Core inputs and core outputs

Three scenario analysis
Presentation ready

DuPont analysis
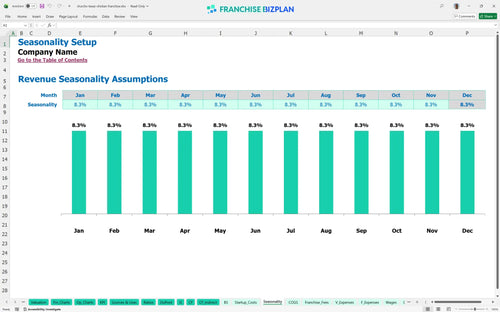
Researched revenue assumptions

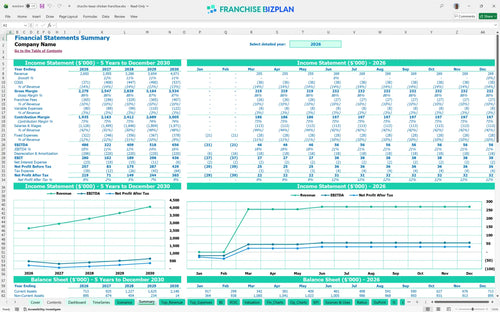
Lender-friendly financial outputs

Revenue stream detailed view
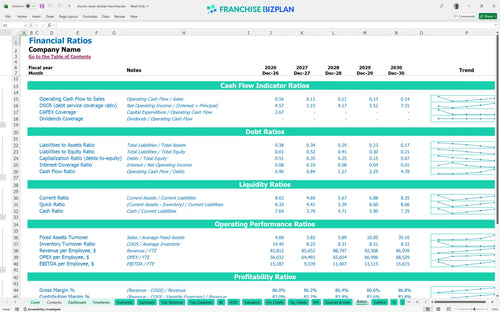
Performance metrics benchmark
We developed this financial feasibility study for quick service restaurants based on extensive research into high-volume chicken units. The model is pre-populated with data like the $2.65M Year 1 revenue target and 10% combined royalty and marketing fees, but you can edit every cell to fit your specific site. This ensures your planning is grounded in the reality of $18,000 monthly rents and 24-hour staffing requirements.
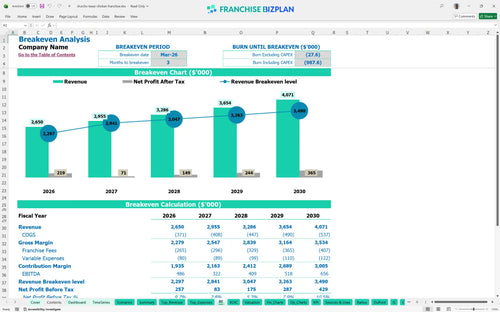
This chicken franchise unit reaches profitability in its first year, generating a $486,000 EBITDA by the end of 2026. After accounting for 12% food costs and a 10% franchise fee burden, the unit generates enough cash to cover its operating expenses within the first three months of trading.
You need $1,100,000 in total capital to launch, which includes the $20,000 franchise fee and $180,000 for drive-thru infrastructure. This startup budget spreadsheet for multi-unit franchise owners ensures you account for restaurant capital expenditure planning and how to calculate startup costs for a fast food franchise accurately.
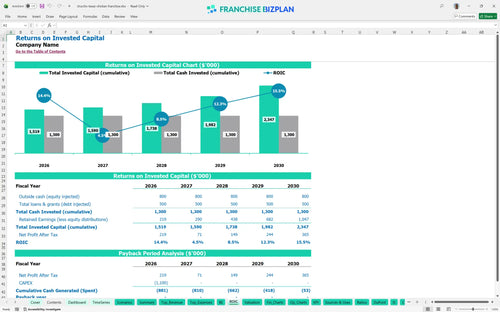
The model projects an IRR of 2.38% and a 1.31 ROE, with the full payback period defintely extending beyond the five-year mark. This ROI analysis for franchises shows that while the initial $1.1M build-out is significant, the year-five EBITDA of $656,000 provides a strong exit or expansion foundation.
The unit hits its monthly break-even point in March 2026, just three months after opening for service. To reach this, you must manage a high-throughput kitchen that covers $18,000 in rent and $4,500 in utilities while you learn how to create a franchise unit budget plan that scales.
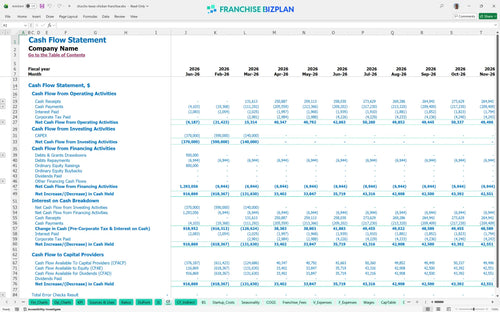
The lowest cash point is $167,000 in March 2026, highlighting the need for a solid opening buffer during the initial ramp-up. Analyzing franchise unit labor and food cost ratios is critical during this phase to ensure the $1.1M initial investment doesn't deplete your working capital before sales peak.
Comparing Low, Medium, and High scenarios shows how revenue forecasting for high volume restaurant locations changes your peak cash need. Estimating profitability for a 24-hour drive-thru franchise using this quick service restaurant financial model allows you to see how a 10% shift in crew productivity impacts your $486,000 Year 1 EBITDA.
This franchise financial model template is built in Excel with open formulas, allowing you to modify every variable from the $18,000 monthly rent to local labor rates. It serves as a financial model template for new restaurant owners who need to adapt a generic plan to a specific high-traffic territory without starting from scratch.

Plan your long-term growth with a fast food franchise business plan that maps out revenue from $2.65M in year one to over $4M by year five. This restaurant franchise cash flow projection excel tool helps you visualize how scaling catering and family packs impacts your unit-level profitability over a sixty-month horizon.

Managing the 5% royalty and 5% marketing fund is simple with this tool, as it uses a precise franchise royalty fees calculation based on your gross sales. It is one of the best financial planning tools for franchise operators who need to track exactly how much cash remains after meeting their brand-standard obligations.

Estimate your total restaurant franchise startup costs, including the $450,000 leasehold improvement and $250,000 kitchen equipment requirements. This break-even analysis for food franchises identifies the specific sales volume needed to cover these fixed investments and transition from ramp-up losses to steady-state profit.

This franchise unit profit and loss template includes benchmarks for 12% food costs and QSR operational expenses to help you spot performance gaps. By comparing your projected margins against these standards, you can ensure your store-level EBITDA stays healthy even as local competition or labor costs fluctuate.


Simply purchase and download the financial model template, then access it instantly using Microsoft Excel or Google Sheets. No installation or technical expertise required-just open and start working.

Enter your business-specific numbers, including revenue projections, costs, and investment details. The pre-built formulas will automatically calculate financial insights, saving you time and effort.

Leverage the investor-ready format to confidently showcase your financial projections to banks, franchise representatives, or investors. Impress stakeholders with clear, data-driven insights and professional reports.

Leverage the investor-ready format to confidently present your projections to banks, franchise representatives, or investors.