
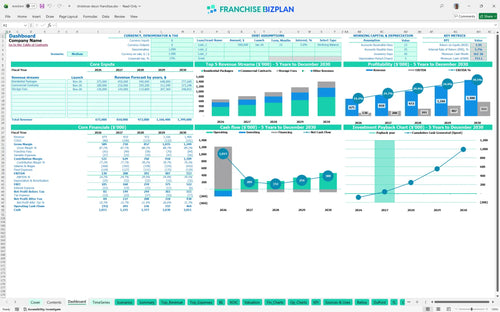
All-in-one Dashboard
Core inputs and core outputs


This Christmas light installation business financial model provides a professional-grade Excel template for forecasting revenue, managing seasonal cash flow, and analyzing the total ROI of your franchise investment.
Core inputs and core outputs
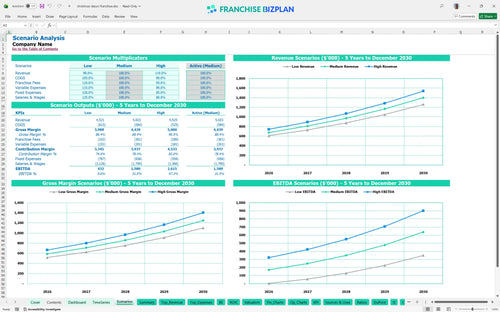
Three scenario analysis
Presentation ready
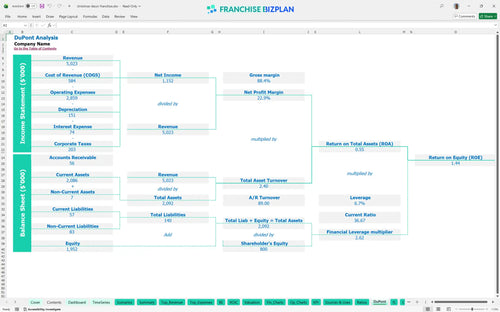
DuPont analysis
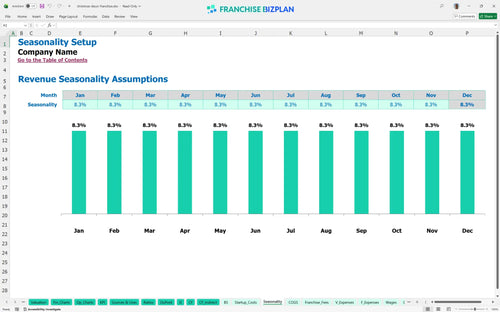
Researched revenue assumptions
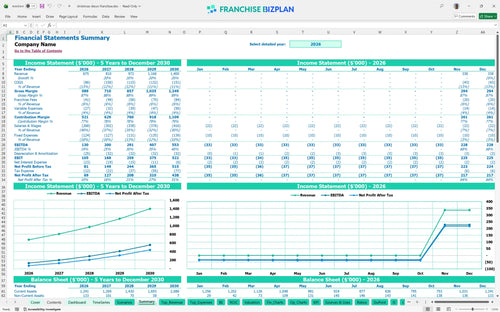
Lender-friendly financial outputs
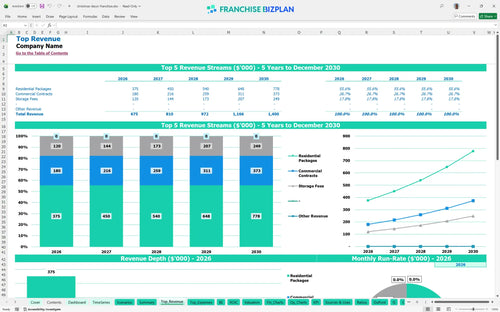
Revenue stream detailed view
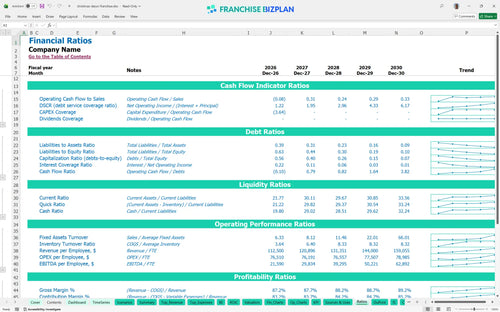
Performance metrics benchmark
We built this residential holiday lighting franchise financial template using deep research into seasonal decor operations and high-end service standards. Key assumptions like the $250,000 initial residential revenue and $60,000 operations manager salary are pre-populated and fully editable to match your specific territory. With a projected 11-month path to break-even and a 2-year payback period, this tool helps you validate the unit economics before signing the agreement.
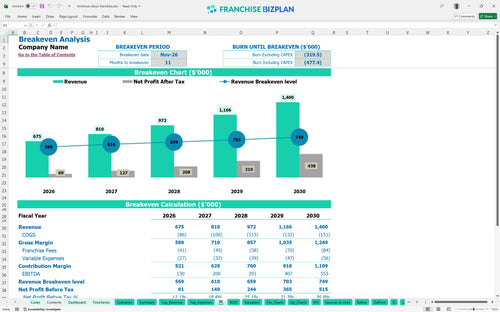
This unit is projected to hit profitability within the first year, reaching a break-even date in November 2026. By year two, EBITDA is expected to climb to $200,000 as you scale commercial contracts and storage fees, which carry lower variable costs than initial installs. Here's the quick math: your EBITDA margin expands from 19% in year one to nearly 40% by year five.
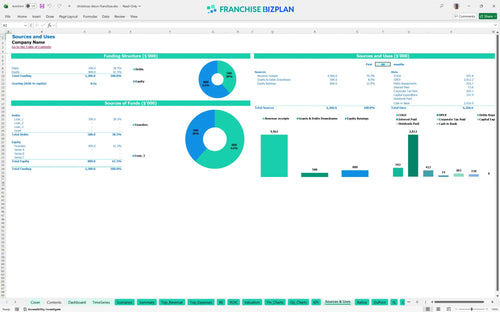
Launching this unit requires a total initial investment of approximately $157,900 plus working capital, as detailed in your capital expenditure planning. The model accounts for the $20,400 franchise fee, $35,000 for vehicles, and $25,000 for initial inventory to ensure you have the assets needed for the first season. What this estimate hides: the timing of leasehold improvements which must be completed before the November launch.
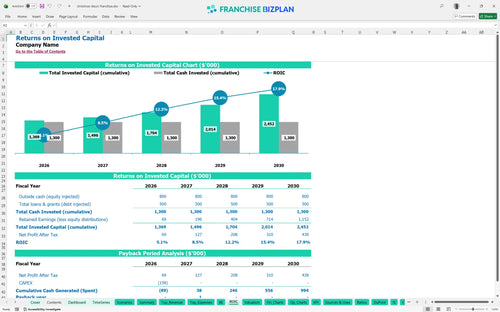
Investors can expect an Internal Rate of Return (IRR) of 5.74% and a Return on Equity (ROE) of 1.44 over the five-year period. With a 2-year payback period, the franchise ROI is realized quickly as revenue scales toward the $1.4 million mark in year five. Still, the real value lies in the recurring storage fees that hit $165,888 annually by year five.
The monthly break-even point is reached in month 11, specifically November 2026, coinciding with the peak residential installation season. To maintain this, you must cover $10,300 in monthly fixed costs, including rent, insurance, and utilities, while managing seasonal labor spikes. Financial forecasting for service-based franchise units shows that throughput during these 26 trading days is the ultimate break-even driver.
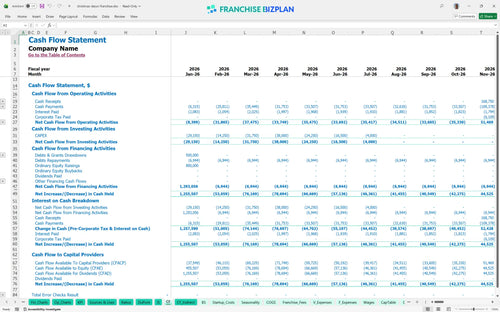
The lowest cash point occurs in October 2026 with a minimum cash balance of $753,000, reflecting the heavy spend on inventory and labor before peak season collections. You defintely need a solid buffer to handle the gap between summer storage prep and winter revenue peaks. This seasonal business cash flow projection assumes you have the liquidity to carry a full crew through the October ramp-up.
The franchise investment analysis tool allows you to toggle between scenarios to see how a 10% drop in residential packages affects your peak cash need. While the medium case shows $130,000 year-one EBITDA, the high case leverages better sales designer productivity to accelerate the 2-year payback period and boost the 5.74% IRR. Honestly, the high case depends entirely on your local marketing execution in affluent enclaves.
This franchise financial model template is a fully editable Excel tool designed to handle the seasonal swings of a holiday lighting business. You can adjust every assumption from residential package pricing to crew supervisor headcount to see how local market conditions impact your bottom line.

Planning for a service-based franchise requires looking past the first season to understand long-term scaling. This franchise business plan template delivers a full 5-year outlook, showing revenue growing from $675,000 in year one to $1.4 million by year five, ensuring your holiday lighting business plan accounts for multi-year growth.

We baked the specific costs of the franchise system directly into the logic, including the $20,400 initial fee and ongoing 5% royalty. By mapping the 1% marketing fund contribution against your projected $810,000 year-two revenue, you can see exactly how much cash stays in the unit after brand obligations are met and evaluate the franchise unit economics.

Use the franchise startup cost calculator to map out your initial $157,900 investment, covering everything from vehicles to climate-controlled storage setup. The model identifies your break-even point, helping you understand the volume of residential and commercial contracts needed to cover your $5,500 monthly hub rent and $2,200 storage lease.

This tool includes built-in profitability analysis for seasonal service businesses, letting you sanity-check your $28,000 installation crew salaries and 11% decor material costs. Comparing your projected EBITDA margins-starting at $130,000 in year one-against industry standards ensures your franchise unit economics remain competitive and realistic.


Simply purchase and download the financial model template, then access it instantly using Microsoft Excel or Google Sheets. No installation or technical expertise required-just open and start working.

Enter your business-specific numbers, including revenue projections, costs, and investment details. The pre-built formulas will automatically calculate financial insights, saving you time and effort.

Leverage the investor-ready format to confidently showcase your financial projections to banks, franchise representatives, or investors. Impress stakeholders with clear, data-driven insights and professional reports.

Leverage the investor-ready format to confidently present your projections to banks, franchise representatives, or investors.